Discover Pandipedia
Pandipedia is the world's first encyclopaedia of machine generated content approved by humans. You can contribute by simply searching and clicking/tapping on "Add To Pandipedia" in the answer you like. Learn More
Expand the world's knowledge as you search and help others. Go you!
Introduction to Digital Twin Technology in Healthcare

Digital twin technology is an emerging force in healthcare, representing a virtual model of a person, organ, or process that is dynamically updated with real-time data from its physical counterpart[4][6]. The National Academies of Sciences, Engineering, and Medicine (NASEM) defines a digital twin as a set of virtual information constructs that mimics a physical system, is updated with data from that system, has predictive capabilities, and informs decisions[6]. This bidirectional interaction between the physical and virtual is central to the concept[6]. However, the term is still considered fuzzy and can vary widely in its application, sometimes used as an umbrella term for any effort to digitalize the human body using computer models and simulations[1][12]. A key application within this domain is the 'virtual patient' (VP), an interactive computer simulation of real-life clinical scenarios designed for training, educating, and assessing health professionals[10]. VPs allow students to practice clinical reasoning and decision-making in a safe, controlled environment without risk to actual patients[10][19].
Constructing the Digital Twin: Data, Modeling, and AI

Creating a patient-specific digital twin requires integrating vast amounts of diverse data to build a holistic view of the individual[4]. Data sources include electronic health records (EHRs), medical imaging like CT and MRI scans, genetic and '-omics' data (genomics, proteomics), and real-time information from wearables, medical devices, and sensors[4][6]. This information also encompasses physical indicators, demographic data, and lifestyle factors[4]. At the core of the digital twin is the virtual representation, which consists of computational models that simulate human physiological phenomena[6]. These models can be mechanistic, based on the physics and biology of the system, or statistical, data-driven models built using artificial intelligence (AI) and machine learning (ML)[4][6]. AI/ML algorithms are essential for analyzing complex datasets, identifying patterns, predicting disease progression, and suggesting personalized treatment plans[4][17]. This AI-driven simulation can then be used to make prognoses and predict future health developments, such as warning a person of an imminent heart disease based on their simulated cardiovascular system[1].
Applications in Clinical Practice and Medical Education
Digital twins are poised to revolutionize healthcare across several domains. In precision medicine, they enable the creation of personalized treatment plans by simulating how an individual might respond to different therapies, allowing clinicians to test interventions on the virtual twin before applying them to the real patient[1][4]. This can improve diagnostic accuracy, reduce medical errors, and optimize drug selection[4]. Beyond individual care, the technology can optimize clinical operations by analyzing workflows and resource allocation, leading to streamlined processes and reduced costs[4][12]. Digital twins also empower patients to take an active role in their own care by providing them with access to their health data and personalized insights, fostering shared decision-making[4][7]. In medical education, Virtual Patient Simulators (VPS) offer a safe and realistic environment for students to enhance their skills[4]. Studies show that VPS training improves students' perceptions of their learning process and helps integrate theoretical knowledge with practical application[16]. This form of simulation is effective for developing crucial skills like clinical reasoning and history taking[10][19].
Validation, Trustworthiness, and the Regulatory Landscape
For digital twins to be adopted in clinical settings, they must be proven reliable and trustworthy[6]. This is achieved through a framework of Verification, Validation, and Uncertainty Quantification (VVUQ)[6]. Verification ensures the underlying code and algorithms are correct, validation assesses how accurately the model represents the real world, and uncertainty quantification formally tracks and communicates the degree of confidence in the model's predictions[6]. The highly personalized nature of digital twins presents a significant validation challenge, as traditional randomized clinical trials (RCTs) based on population averages are not suitable for an 'N-of-1' experiment[6]. Alternative approaches, such as personalized trials that randomize treatment periods within a single patient, are being explored[6]. The regulatory landscape is still evolving to keep pace with this technology[15]. The dynamic, continuously updating nature of digital twins challenges existing FDA frameworks for medical devices[6]. Despite these hurdles, some commercial applications have achieved regulatory success. HeartFlow, for instance, received FDA clearance for its AI-driven platform that creates patient-specific models for coronary artery disease, demonstrating that robust VVUQ is critical for market approval[6]. Other companies like IQVIA are also advancing commercial digital twin solutions, indicating the technology is already being implemented[8].
Ethical Issues and Societal Risks

The rise of digital twins introduces a host of complex ethical, legal, and societal implications[13][15]. Privacy is a primary concern, as these systems require a persistent, detailed picture of a person's biological, genetic, and lifestyle information[12]. This creates risks of 'big data discrimination' by entities like insurance companies, and it amplifies the potential damage from security breaches or data leaks[12]. The technology also raises questions of inequality, as it may widen the gap between those who can afford it and those who cannot[12]. Furthermore, AI models can inherit and perpetuate existing biases in healthcare data, which is often skewed towards certain demographics[12]. A central ethical challenge revolves around control and autonomy: who has the power to direct how a person's digital representation is used, and how can we prevent the simulation from being used against the individual's interests[1]? This leads to the risk of what has been termed 'illegitimate replacement' of the person by the simulation[1]. Finally, there is the question of accountability. If a diagnosis based on a digital twin is wrong, it can be difficult to determine whether the physician or the technology is responsible[12].
Let's look at alternatives:
- Modify the query.
- Start a new thread.
- Remove sources (if manually added).
Transcript
Curious about the AI revolution? In the next minute, we'll break down the technology powering it all: foundation models. The future of AI is models that are trained on a broad set of unlabeled data that can be used for different tasks with minimal fine-tuning. Think of it like this: you learn to drive one car, and with a little effort, you can drive most other cars. Foundation models work similarly, applying knowledge from one situation to another. You've likely heard of them, models like GPT-4, BERT, and DALL-E are all pioneering examples. They can handle jobs from translating text and analyzing medical images to generating entirely new content. But they have limitations. They can sometimes fabricate answers, a phenomenon known as hallucination. And since they are trained on vast datasets, they can learn and amplify harmful biases, which can disproportionately harm marginalized groups. Despite these challenges, foundation models are the cornerstone of the next generation of intelligent systems, offering scalable and adaptable frameworks for advanced AI applications.
Let's look at alternatives:
- Modify the query.
- Start a new thread.
- Remove sources (if manually added).
Get more accurate answers with Super Pandi, upload files, personalised discovery feed, save searches and contribute to the PandiPedia.
The National Quantum Initiative Act was signed into law in December 2018.
The European Union launched its Quantum Flagship program to lead in quantum tech by 2030.
China has invested $15 billion in quantum technology research and development.
The US National Quantum Initiative allocated over $1.2 billion for quantum advancements from 2019 to 2023.
Australia unveiled its National Quantum Strategy in 2023, aiming for technological leadership.
Let's look at alternatives:
- Modify the query.
- Start a new thread.
- Remove sources (if manually added).
The Imperative for AI Upskilling
Artificial intelligence (AI) represents a significant change management opportunity that could determine success across every industry[1]. As businesses integrate AI, they have a pivotal responsibility to help employees learn new skills, not only for the employees' benefit but for the company's long-term survival and competitiveness[3]. The World Economic Forum has estimated that automation will displace 85 million jobs by 2025, with 40% of core skills changing for workers[1]. Despite this urgency, a significant gap exists between recognizing the need and taking action. A 2024 study found that while 89% of respondents said their workforce needs improved AI skills, only 6% reported having begun upskilling in a meaningful way[1]. This highlights the critical need for structured strategies to prepare the workforce for the AI era. Companies that successfully enhance AI competencies will gain a competitive advantage over those that fail to upskill or reskill their employees[1].
Competency Mapping: The Foundation of Workforce Transformation
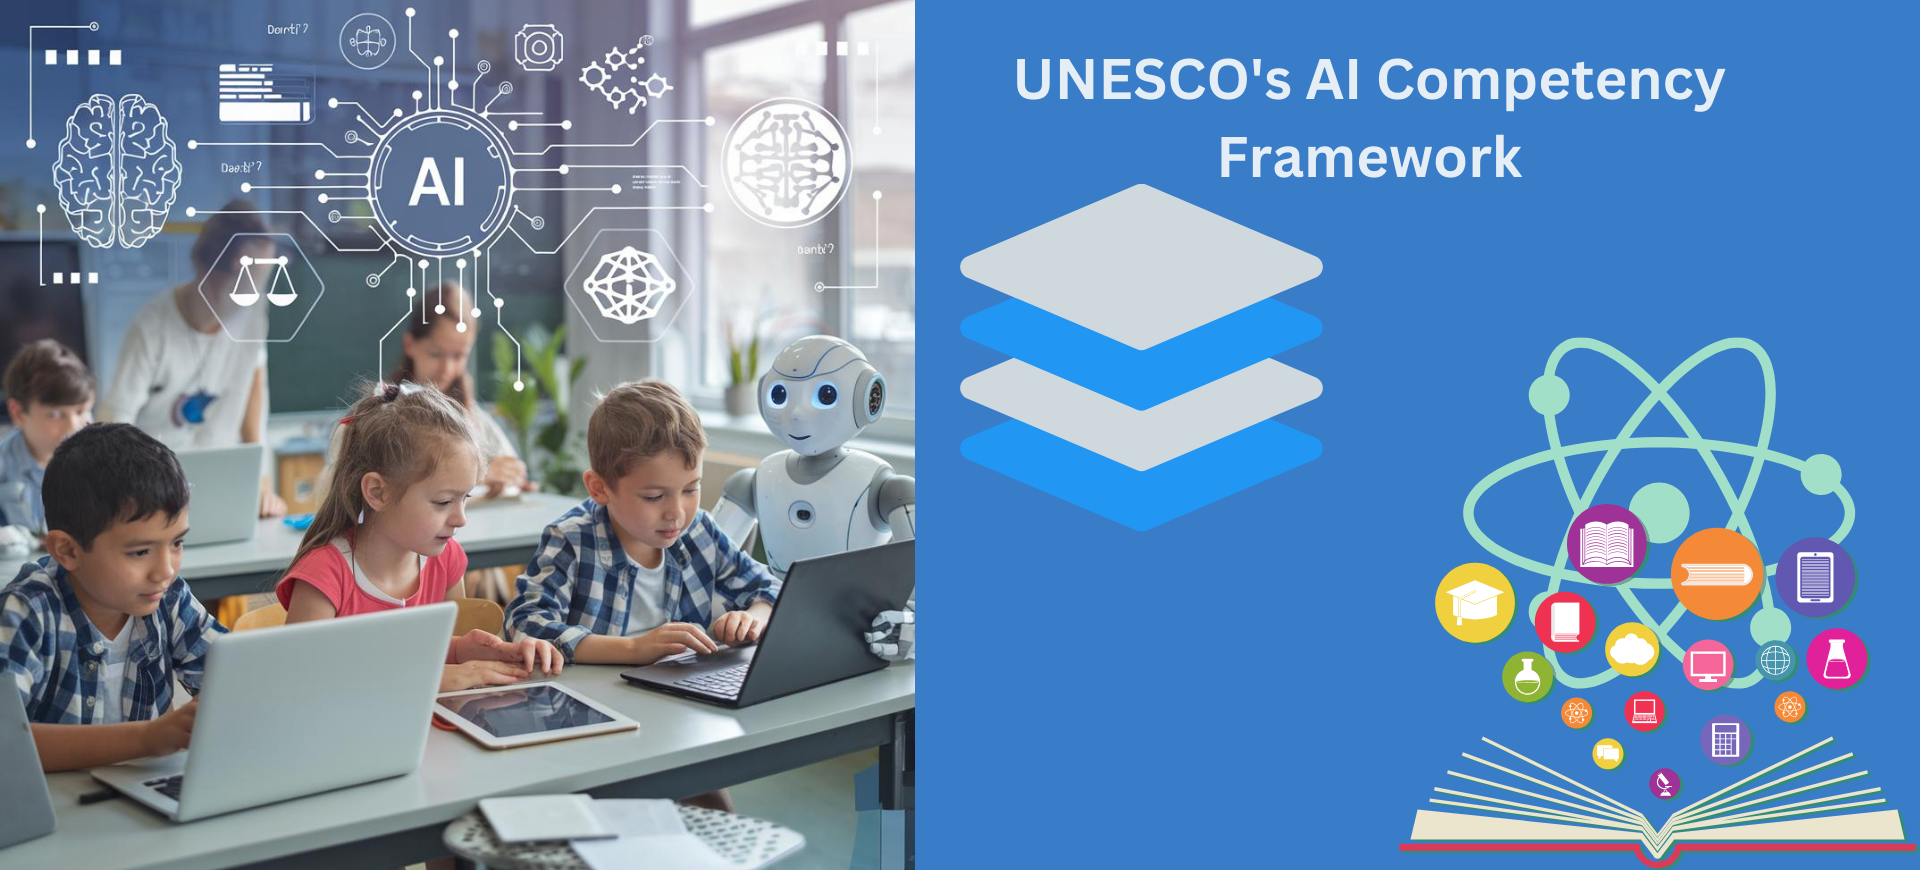
Competency mapping is a foundational strategy that identifies the specific skills, behaviors, and knowledge employees need to perform effectively in their roles[2]. Unlike traditional skill assessments, it emphasizes holistic performance by integrating technical, behavioral, and leadership competencies[2]. In the context of AI, competency mapping has evolved from a support tool into the strategic backbone of workforce transformation[2]. AI and advanced analytics are transforming competency mapping from a static framework into a living, data-driven system that can analyze performance data, learning patterns, and market trends in real time[2]. This allows organizations to anticipate future skill needs and create targeted learning paths to bridge critical gaps[2]. For example, the AI competency framework developed by Concordia University and Dawson College outlines core competencies for AI practitioners across technical, business, and human domains, with ethical considerations integrated throughout[12]. Similarly, UNESCO's framework aims to empower students to become skilled and responsible users of AI, focusing on a human-centered mindset and the ethics of AI[6][13]. By linking competencies to role progression, competency mapping becomes the engine that powers career growth, internal mobility, and scalable reskilling initiatives[2].
Micro-Credentials: Flexible and Targeted Learning
Micro-credential programs have emerged as a key tool for workforce upskilling, offering a "short, competency-based recognition that allows an educator to demonstrate mastery in a particular area"[11]. These programs cater to the need for cost-effective and flexible learning, allowing professionals to stay current with emerging technologies without undergoing long-form education[11]. The market for micro-credentials is ballooning, with more than 60% of U.S. colleges and universities now offering or considering such programs[11]. Major technology companies and educational platforms, including Microsoft, IBM, Google, Coursera, and Udacity, offer various micro-credential programs in high-demand fields like data science, AI, and cybersecurity[11]. These programs are typically viewed as a supplement rather than a replacement for traditional degrees, helping to bridge the gap between a student's major and the specific requirements of a job[11]. For employers, they offer a way to provide cost-effective staff development, while for employees, they represent a flexible path to acquiring new, in-demand skills[11].
Public-Private Partnerships: Collaborative Pathways to Success
Addressing the vast skills gap created by AI requires a collaborative approach, as no single entity can solve this challenge alone[4]. Public-private partnerships, which bring together employers, government officials, workforce leaders, educational institutions, and non-profits, are essential for creating effective reskilling pathways[4]. These initiatives build a regional workforce infrastructure that is more resilient, equitable, and future-proof[4]. The success of these programs hinges on employer leadership; companies are not engaging in charity but are making "specific, strategically driven investments in partnerships that help them strengthen their talent pipelines"[4]. Higher education institutions must be proactive in these conversations to remain competitive and relevant, as employers may otherwise fund their own training programs[7]. By working together, these coalitions can co-create pathways into skilled jobs for displaced workers and ensure that training programs are aligned with real-world workforce requirements[4][7].
A Strategic Roadmap for HR Leaders

While there is no one-size-fits-all timeline, HR leaders can follow a structured approach to implement a successful AI upskilling strategy.
Phase 1: Strategy and Communication
Begin by anchoring the upskilling initiative to strategic organizational priorities such as digital transformation or innovation[1][2]. It is crucial to communicate clearly with employees about the company's approach to AI, reinforcing how it will help them in their jobs and minimize nervousness about job loss[1][3]. Managers should involve employees in decision-making around AI implementation and point out opportunities for professional development[3].
Phase 2: Skills Assessment and Gap Analysis
Conduct a thorough review of existing processes to identify areas where AI can improve efficiency[3]. Leverage AI-powered tools to continuously assess the workforce's existing skills and identify gaps[9]. For instance, AI can analyze job postings for emerging skill requirements and compare them against current employee talent profiles[9]. This skills gap analysis will serve as a roadmap for designing targeted training initiatives[3].
Phase 3: Design and Deployment of Learning Programs
Invest in learning and development programs tailored to the identified needs[1]. Use AI to create personalized learning experiences, recommend relevant content, and adjust the difficulty level based on employee progress[1][9]. A key tactic is to integrate training into the daily flow of work, which makes learning more seamless and accessible[3]. This can be supplemented with on-the-job training, mentorship programs, and career path development, all of which can be enhanced by AI[1].
Phase 4: Fostering a Culture of Continuous Learning
Finally, nurture an open culture of learning that encourages experimentation and collaboration across departments[3]. Building a workplace culture of lifelong learning involves rewarding and recognizing learning, ensuring visible leadership support, and providing equal access to training opportunities[3]. AI can support this culture by predicting future trends and consistently recommending relevant training, helping to keep the workforce agile and future-ready[9].
Let's look at alternatives:
- Modify the query.
- Start a new thread.
- Remove sources (if manually added).
The Widening Adaptation Finance Gap
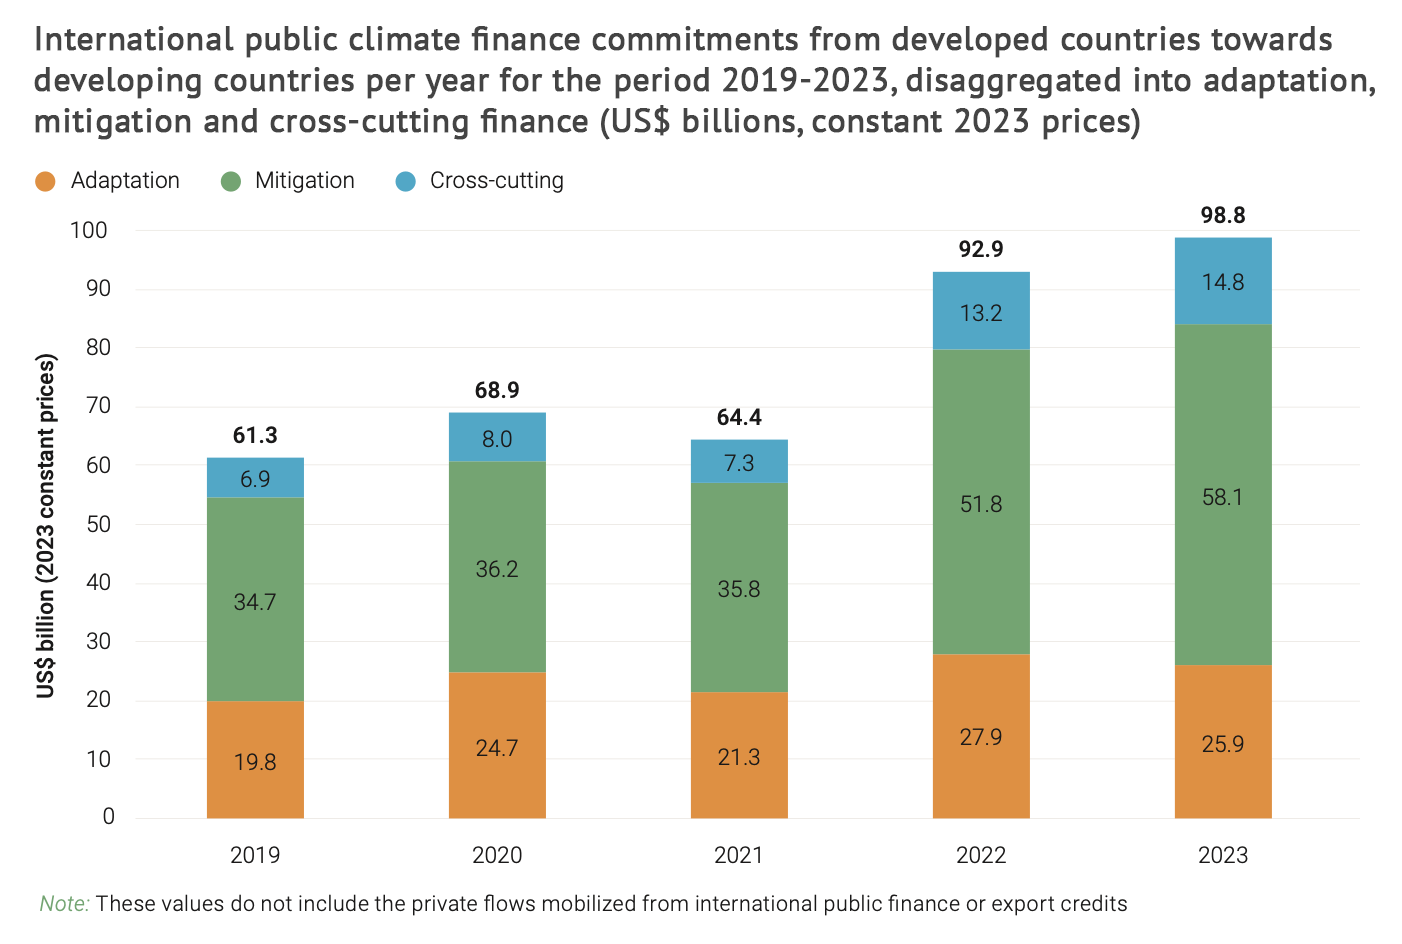
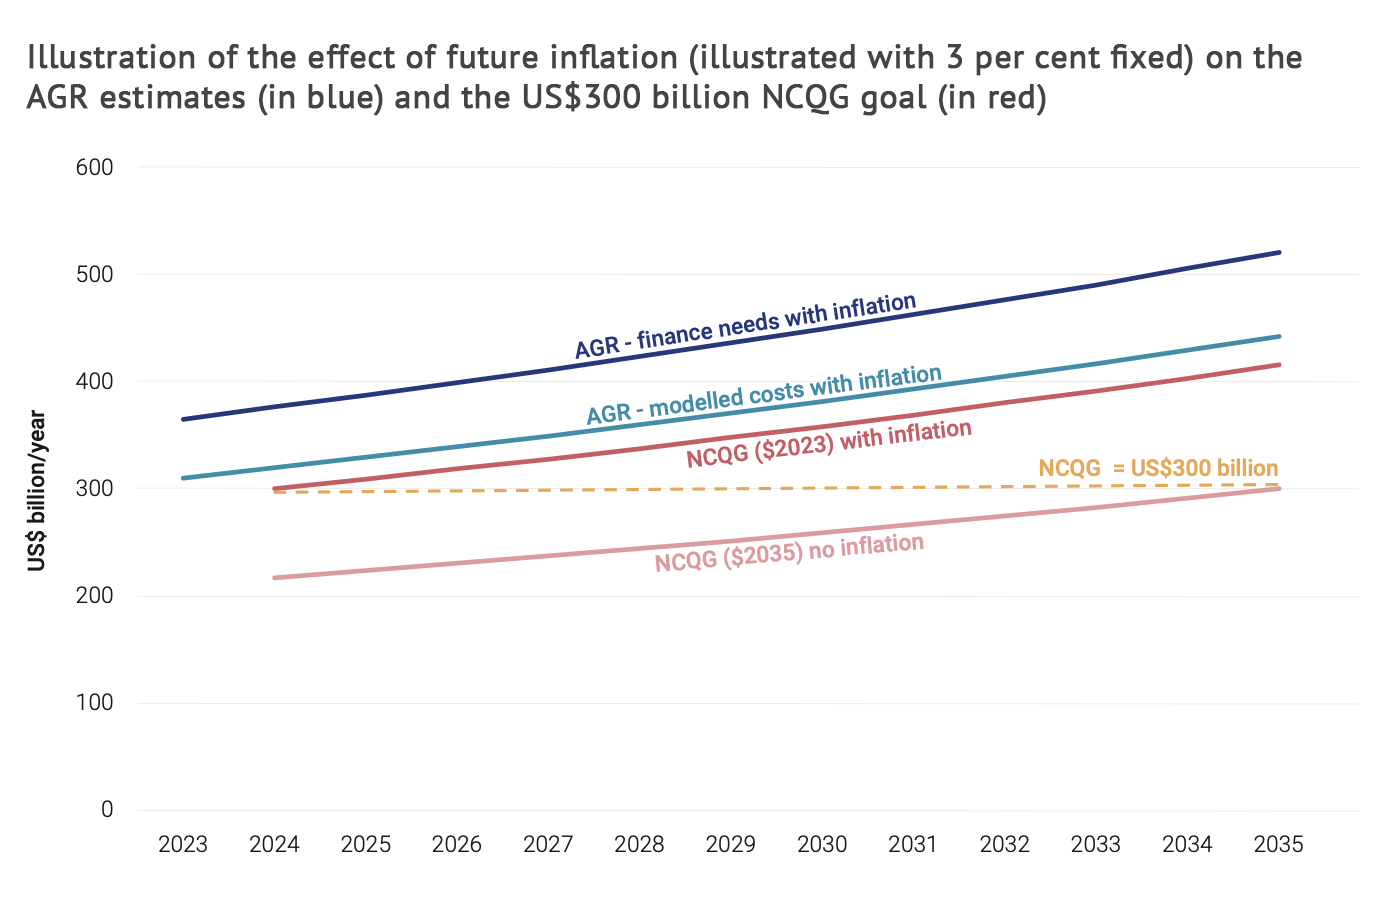
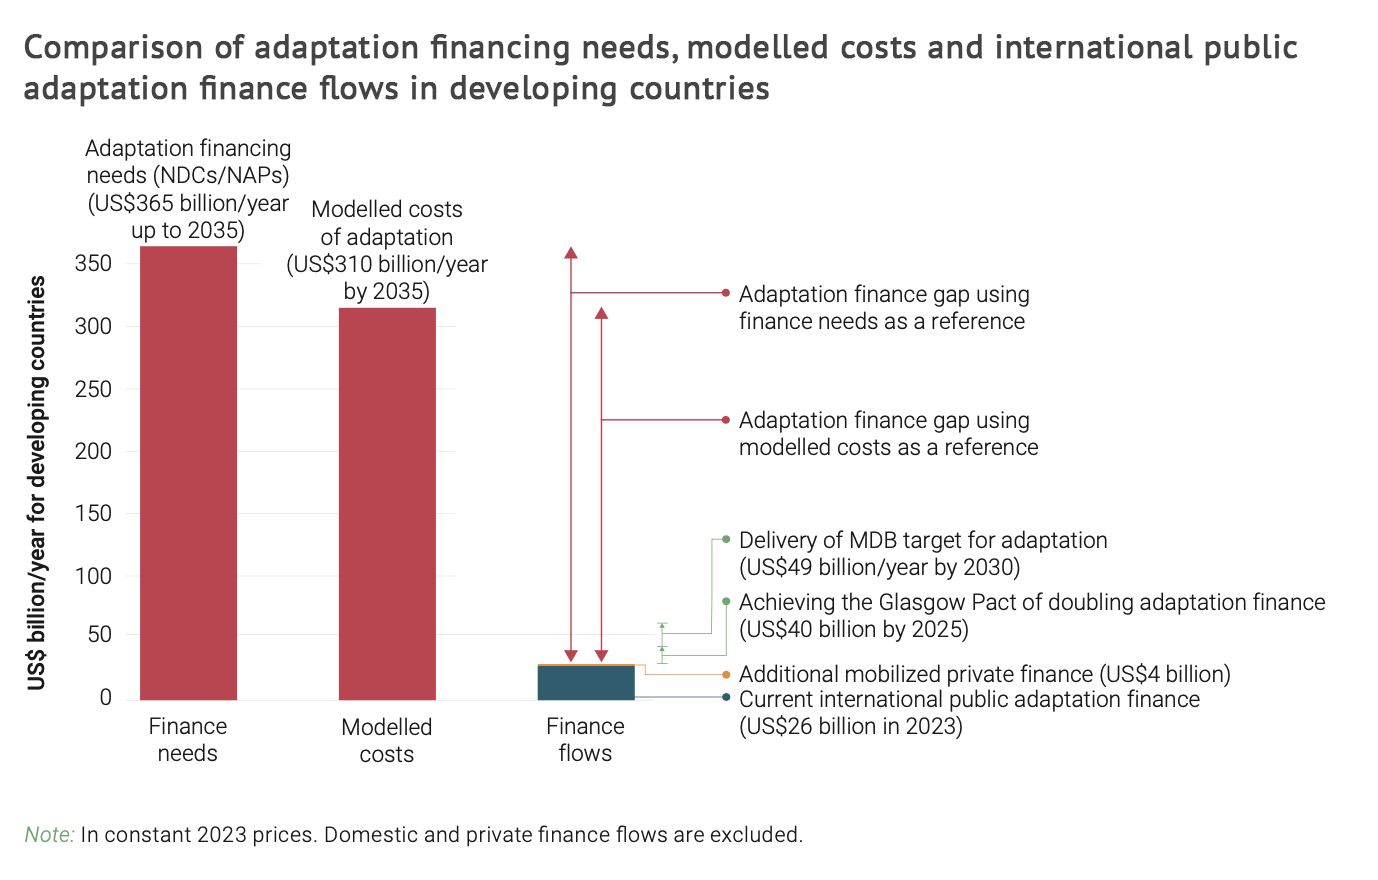
Despite its critical importance, climate adaptation is often viewed as the 'lesser cousin' of mitigation in terms of both focus and finance[1]. This disparity has created a significant funding gap that widens annually[1]. Developing nations are projected to need between $215 billion and $387 billion per year by 2030 for adaptation, yet financing reached only $63 billion in 2021-2022[1]. The UN Environment Programme (UNEP) calculates the current adaptation finance gap for these nations to be in the range of $284-339 billion per year by 2035, meaning their needs are 12 to 14 times greater than current financial flows[3]. Consequently, developed nations are on track to miss their COP26 goal of doubling 2019 adaptation finance levels by 2025[3]. Traditional instruments like debt, equity, and grants are insufficient to meet this demand, as there is not enough traditional capital available, and many developing countries lack the fiscal space to scale this type of finance[1]. Regional needs vary widely; Africa's adaptation costs are projected to reach up to $50 billion annually by 2050, while Small Island Developing States (SIDS) require an estimated 3.4% of their GDP each year for climate adaptation[4].
The Role of Multilateral Development Banks
Multilateral development banks (MDBs) are major providers of the climate finance that vulnerable nations need[2]. In 2024, MDBs achieved a record $137 billion in global climate financing, a 10% increase from the previous year, with over $85 billion directed to low- and middle-income economies[10]. However, progress is mixed. While every MDB hit a record high for total climate finance in 2023, funding for adaptation continues to lag behind mitigation[2]. In fact, public money for adaptation from richer nations fell in 2023, partly due to a decline in funding from MDBs[3]. The quality of finance is also a concern, as 67% of MDB climate finance to developing economies between 2019 and 2023 came as investment loans, while the share of grants decreased[2]. This is problematic for the three-fifths of low-income countries already at risk of or in debt distress[2]. In response to calls for reform, MDBs have pledged to provide $120 billion annually in climate finance for low- and middle-income countries by 2030, with $42 billion earmarked for adaptation[10].
Innovative Financial Instruments to Mobilize Capital
To bridge the funding gap, innovative financial instruments are emerging to mobilize significant new capital from the private sector, institutional investors, and philanthropists[1]. These instruments often use creative design and risk-sharing to make investments more attractive[1]. Key approaches include:
- Blended Finance: This method uses catalytic public or philanthropic capital to increase private sector investment[8]. It leverages concessional capital to reduce risk or enhance returns for commercial investors[1].
- Risk-Sharing and Insurance: Instruments like parametric insurance and catastrophe bonds provide quick liquidity after climate disasters[1]. Credit guarantees, where an entity like an MDB covers potential loan defaults, also help de-risk investments for the private sector[1].
- Resilience Bonds and Debt Instruments: The Asian Infrastructure Investment Bank (AIIB) launched a climate adaptation bond that raised AUD500 million for climate-resilient infrastructure[1]. Other tools include climate-resilient debt clauses, which allow for a temporary pause on loan repayments after a disaster, and debt-for-nature swaps, where countries receive debt waivers for meeting conservation targets[1].
- Results-Based Finance: These instruments channel funds toward projects that deliver tangible outcomes[1]. Examples include Payment for Ecosystem Services (PES) arrangements and adaptation benefits mechanisms, which provide fiscal credits for achieving adaptation goals[1][8].
Community-Level Projects and Nature-Based Solutions

Effective adaptation finance translates into tangible, community-level projects, with a growing emphasis on Nature-Based Solutions (NbS)[4]. NbS offer cost-effective, long-term strategies that enhance resilience while providing co-benefits for biodiversity and local livelihoods[4]. For example, the Landscape Resilience Fund, supported by partners like the WWF and Chanel, invested in Koa, a Swiss-Ghanaian cocoa company[1]. This initial investment helped secure over $5 million in additional private funding to enhance cocoa production and improve farmers’ resilience in Ghana[1]. In Kenya, a blended finance project combined community equity, World Bank grants, and microfinance loans to connect 1,500 households in arid regions to new and improved water infrastructure[8]. In Nepal, a concessional loan from the International Finance Corporation was blended with private equity to help small and medium-sized agribusinesses adopt climate-resilient practices for key crops like rice and maize[8]. Another innovative model is the Quiroz-Chira Water Fund in Peru, which uses a Payment for Ecosystem Services (PES) mechanism. Downstream water users, including municipalities and water boards, voluntarily contribute to a fund that finances upstream conservation and ecosystem recovery, protecting the water source for over 500 families and impacting over 18,000 hectares of land[8].
Measuring Resilience to Track Progress and Impact

A critical challenge in climate adaptation is the lack of tools to easily answer the question, 'how resilient are we?'[14]. While many indicators exist to measure social vulnerability and climate hazards, they do not reveal whether the systems that form the core of resilience are functioning effectively[14]. Measuring the progress and outcomes of adaptation strategies is crucial for assessing and optimizing their effectiveness[5]. This requires developing both process-related metrics, which track planning and resource allocation, and outcome-related metrics, which assess performance during shocks and stresses[5]. As a model, the U.S. federal government developed a common set of five process-related indicators for its Climate Adaptation Plans, covering whether resilience is integrated into budgeting, data systems are updated, policies incorporate nature-based solutions, supply chains are evaluated for risk, and staff are trained[5]. To be effective, indicators must be aligned with stakeholder priorities[14]. A project in New York City analyzed 41 community-based resilience plans to identify shared goals and develop corresponding indicators[14]. The ultimate goal is to create user-friendly tools, such as a 'resilience report card,' that can help officials triage funding, enable advocates to build public pressure for government action, and empower communities to guide local resilience planning[14].
Let's look at alternatives:
- Modify the query.
- Start a new thread.
- Remove sources (if manually added).
Let's look at alternatives:
- Modify the query.
- Start a new thread.
- Remove sources (if manually added).
Get more accurate answers with Super Pandi, upload files, personalised discovery feed, save searches and contribute to the PandiPedia.
Introduction
Understanding body composition is essential for assessing health in aging populations, especially when evaluating changes in muscle mass, fat distribution, and bone density. In clinical and community settings, two primary tools are widely used: Dual-Energy X-ray Absorptiometry (DEXA) and Bioelectrical Impedance Analysis (BIA). DEXA is recognized as a gold standard for its precision and comprehensive analysis, while BIA offers a more accessible, cost-effective alternative despite its limitations. This report synthesizes key passages from various sources to compare accuracy, cost, radiation exposure, and accessibility for making informed decisions in clinical practice and for consumers[4][7].
Accuracy Comparison
DEXA scans use two low-dose X-ray beams to directly measure bone mineral density, fat mass, and lean mass, offering highly accurate data that is largely unaffected by external factors such as hydration, recent food intake, or skin temperature[4]. In contrast, BIA devices estimate body composition by measuring the resistance to an electrical current, but their accuracy can vary significantly due to factors like hydration status, electrode placement, and population-specific variables[1]. Studies have shown that while certain advanced BIA devices can correlate well with DEXA for measures such as fat mass in specific populations, the overall concordance—especially for parameters like fat-free mass—remains moderate[2]. Additionally, some investigations in particular groups (e.g., Hispanic diabetics) reveal that BIA may overestimate or underestimate body composition measures when compared to DEXA, suggesting that DEXA remains the preferred method for precise body composition analysis in aging individuals[3].
Cost Considerations
Cost is a prominent factor when choosing between DEXA and BIA. BIA devices are significantly less expensive, portable, and easier to operate, making them a popular choice in community health settings and for repeated monitoring over time[7]. On the other hand, DEXA requires specialized equipment that is usually located in hospital or specialized imaging centers, which results in higher costs for both the facility and the patient. However, despite the increased cost, DEXA provides a level of detail and accuracy that is critical for diagnosing conditions like osteoporosis and for tailoring individualized health interventions based on precise body composition data[4].
Radiation Exposure
Radiation exposure is a common concern, especially when monitoring disease progression or evaluating changes in body composition over time. DEXA scans involve low-dose ionizing radiation, typically less than 10 microSieverts, which falls within safe limits for diagnostic procedures and is justified by the clinical benefits provided by the detailed measurements[5]. In contrast, BIA methods do not involve any radiation risk, which is an advantage for repeated measurements; however, the trade-off remains the lower accuracy and sensitivity to internal and external variations in parameters such as hydration[1].
Accessibility and Practical Considerations

When considering accessibility and practical usage, BIA devices have the advantage of portability and ease of use. They can be easily employed in a range of settings—from clinics to gyms and community centers—making them a valuable tool for routine screening and monitoring in aging populations[1]. DEXA, while more accurate, is typically confined to specialized imaging centers due to the need for dedicated machinery and trained technicians. For clinicians who require in-depth analysis of body composition, including regional distribution of fat (such as visceral fat) and measurements for bone density, DEXA provides detailed insights that are critical for diagnosing conditions and planning personalized interventions[4]. Thus, while BIA is beneficial for its accessibility and lower cost, its results may be influenced by factors like hydration and electrode placement, making it less ideal for clinical decisions that require high precision[7].
Decision Flowchart for Clinicians and Consumers
To assist clinicians and consumers in choosing the appropriate method for body composition assessment in aging populations, the following decision flowchart is provided:
-
Define the clinical or personal objectives:
- If the purpose is to obtain detailed and precise measurements including bone density, visceral fat, and muscle mass distribution, proceed with DEXA.[4].
- If the goal is a quick screening or routine monitoring with limited resources, BIA is an acceptable alternative, keeping in mind its sensitivity to changes in hydration and environmental factors[7]. -
Evaluate cost and resource availability:
- Consider DEXA when the budget allows for more expensive, specialized testing, especially when precise longitudinal data is needed.
- Opt for BIA in settings with lower financial constraints or where rapid, repeated measurements are required[1]. -
Consider radiation exposure:
- DEXA uses low-dose radiation, which is generally safe and justified for the detailed assessment it offers; however, for patients requiring very frequent assessments or for vulnerable groups, this factor should be considered[5].
- BIA does not involve radiation and is therefore preferable when radiation avoidance is a priority. -
Assess accessibility and operational needs:
- If the patient or facility can access specialized imaging centers, DEXA is recommended.
- When portability and ease of use are paramount, such as in primary care or remote settings, BIA is more practical.
This flowchart guides decision-making by clearly balancing the trade-offs between accuracy, cost, radiation, and accessibility, ensuring that clinicians and consumers select the method best suited to their specific needs.
Conclusion
In summary, DEXA and BIA each have distinct advantages and limitations for assessing body composition in aging populations. DEXA offers unparalleled accuracy by directly measuring fat, muscle, and bone density through low-dose X-rays and is indispensable for detailed clinical assessments and for conditions such as osteoporosis. However, its higher cost and limited accessibility may restrict its widespread use in routine screening. Conversely, BIA provides an affordable, portable, and radiation-free alternative that is well-suited for community-based monitoring, although its accuracy can be affected by methodological variables such as hydration and electrode positioning. Ultimately, the choice between these tools should be guided by the specific clinical or consumer needs, resource availability, and the required precision of the measurements. This integrated analysis supports informed decision-making by balancing high-precision requirements with practical considerations tailored for aging populations[8].
Let's look at alternatives:
- Modify the query.
- Start a new thread.
- Remove sources (if manually added).
Transcript
Fact‐checking plays an important role in challenging false claims, but it is not enough on its own. When corrections are issued after misinformation has already spread on fast moving social media, they often fail to overcome the deep influence of false narratives. This happens because many people remain swayed by misleading ideas due to natural cognitive biases and strong emotional reactions that make post‐hoc corrections less effective. That is why a layered approach is needed. Combining fact‐checking with proactive measures such as media literacy training, interactive educational programs that teach how to verify sources, and pre‐emptive messages designed to build resistance against manipulation creates a more robust defense against misinformation. In addition, while automated fact‐checking tools can help monitor and flag false claims, human judgment is still essential to understand context and nuance. Together, these layered solutions work to build a healthier information ecosystem and empower citizens to make truly informed decisions.
Let's look at alternatives:
- Modify the query.
- Start a new thread.
- Remove sources (if manually added).
Let's look at alternatives:
- Modify the query.
- Start a new thread.
- Remove sources (if manually added).
Let's look at alternatives:
- Modify the query.
- Start a new thread.
- Remove sources (if manually added).


