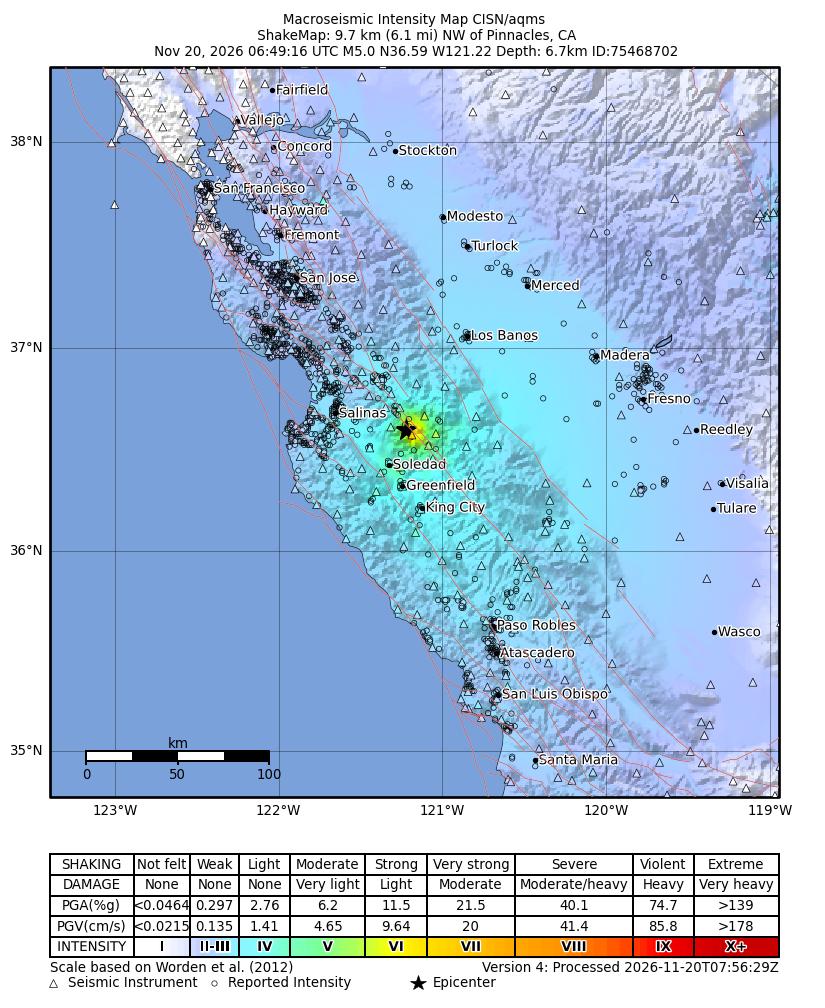
What the colours on the Pinnacles earthquake map mean
Find the black star near Soledad. It marks the epicentre. The colour bands show estimated shaking intensity by location, from weaker blue farther away to stronger greens near the star. The USGS event record listed a reviewed magnitude of 5.0 when checked on 20 November, alongside an earlier 5.4 estimate. Those numbers estimate the size of the event. The map estimates what the shaking was like in different places. Its damage row is a guide to typical effects, not an inventory of damage from this earthquake.