Discover Pandipedia
A growing directory of useful answers selected by the Pandi community. Search the collection or browse the latest discoveries.
2323 entries available

latest digital wellness academic papers. Locate peer reviewed studies on device use impacts. For scholarly citation and deep dives.
Curated sources
Sources are organized around the requested evidence needs.

Smartphone screen time reduction improves mental health: a randomized controlled trial
Let's look at alternatives:
- Modify the query.
- Start a new thread.
- Remove sources (if manually added).
How nature immersion programs improve executive function. Review academic studies on attention restoration theory and real world immersion camps. Suggest program design elements for organizations.
Nature Immersion and Executive Function: What the Evidence Supports
Nature immersion programs may improve specific attention-related outcomes, but current evidence does not establish a broad, reliable improvement in executive function. The strongest findings concern selective or sustained attention, selected working-memory tasks, and response stability. Evidence from real-world residential camps is much weaker for executive function because the available camp studies primarily measured well-being, nature connection, psychological functioning, or self-regulation rather than standardized executive-function tasks.
This review distinguishes directed attention, sustained and selective attention, working memory, response stability, and broader executive functions such as inhibition and cognitive flexibility. It then translates the evidence into cautious design options and an evaluation plan for organizations.
What Attention Restoration Theory Reviews Found
The 2016 systematic review found some positive effects of natural-environment exposure, but the results were selective rather than universal. Statistically significant improvements were reported for Digit Span Forward, Digit Span Backward, and Trail Making Test B.[1]
These results suggest possible benefits for particular working-memory-related and executive-task measures, not a general improvement in executive function. The supplied review summary does not establish consistent effects on inhibition, cognitive flexibility, or every form of directed or sustained attention.
The 2018 review revisited the Attention Restoration Theory claim that nature can restore a limited cognitive resource often described as directed attention. Rather than treating all attention tests as equivalent, it proposed a process-specific framework for identifying which task components actually depend on directed-attention-related processes. This framework indicates that future studies should match claims about restoration to the particular cognitive process measured, rather than using broad labels such as “attention” or “executive function.”[2]
- Working memory: The 2016 review reported positive effects on forward and backward digit span, but the available evidence does not show that all working-memory tasks improve.[3]
- Executive control and flexibility: Trail Making Test B showed a positive effect in the 2016 review, but this single measure does not establish consistent improvement in inhibition or cognitive flexibility.[4]
- Directed attention: The reviews address the possibility of restoration, but the supplied evidence does not support the claim that directed attention improves uniformly across tasks or populations.[5]
The 2016 review emphasized substantial diversity in populations, study designs, and outcome measures, and was motivated by uncertainty about how much evidence actually supported Attention Restoration Theory. The 2018 process-specific framework further reflects the field's need for better conceptual discrimination among attention processes. The supplied summaries do not provide full risk-of-bias assessments, sample counts, or study-level methodological details, so conclusions should remain cautious.[6]
Evidence From Real-World Nature Exposure and Camps
Two Finnish field studies examined self-paced walks of 4 to 6 km in a coniferous forest and an urban park. Participants completed self-report measures and the Sustained Attention to Response Task before and after walking. Mood and self-reported restoration improved, and sustained attention improved across versions of the activity, including some improvement after walking without the added psychological tasks.[7][8][9]
These findings support a cautious claim about sustained attention, which was the reported directed-attention-related outcome in that study. They do not establish improvements in working memory, inhibition, cognitive flexibility, or directed attention as a broad construct. The added psychological tasks did not produce additional affective or self-reported restoration benefits, and the authors called for replication and research on longer-term or cumulative effects.[10][11][12]
A child study comparing a 30-minute natural-environment walk with an urban walk found faster and more stable responding on the Attention Network Task, along with different gaze allocation during the natural walk. Importantly, it found no improvement in executive or directed attention. Response speed and stability should therefore not be presented as evidence of improved broad executive function.[13][14][15]
A green-school study found better selective and sustained attention when children completed an attention task outdoors in a school garden or other green setting than indoors. It did not measure working memory or executive function with a dedicated broad battery, and its short-term within-subject design cannot establish effects of residential immersion, wilderness expeditions, or cumulative exposure.[16][17][18]
The four-week residential wilderness camp study is relevant to real-world immersion, but it did not directly test executive function. It reported changes in nature exposure, nature-related skills, nature connection, relaxation, perceived stress, emotional states, and spiritual well-being. Because it had no control group, a small sample, post-camp attrition, and possible confounding from the cell-phone-free setting, it cannot show that wilderness immersion caused executive-function gains.[19][20][21][22][23]
Similarly, a large evaluation of trauma-informed wilderness therapy with adolescents reported improvements in psychological, family, and psychophysiological functioning, but it was described as a pilot study and the supplied findings do not identify standardized working-memory, inhibition, or cognitive-flexibility outcomes.[24][25]
Evidence Synthesis and Confidence
Overall confidence is moderate for short-term, selective or sustained-attention effects, low to moderate for selected working-memory or executive-task effects, and low for broad executive-function improvement from immersion camps. The evidence is stronger when studies use direct behavioral tasks and a comparison condition, and weaker when they rely on uncontrolled pre-post designs or broad self-report outcomes.
| Outcome | What the evidence suggests | Confidence and boundary |
|---|---|---|
| Selective and sustained attention | Improvement was reported in field walks and a green-school setting.[26][27] | Promising, but studies were short-term and varied in design. |
| Working memory | Forward and backward digit span improved in the 2016 review.[28] | Selective task evidence, not proof of a general working-memory effect. |
| Response speed and stability | Children showed faster and more stable responses after a natural walk.[29] | Distinct from executive function; the study found no improvement in executive or directed attention.[30] |
| Broad executive function | Camp and school studies did not provide direct evidence across working memory, inhibition, and cognitive flexibility.[31][32] | Evidence is insufficient for a broad causal claim. |
| Well-being and restoration | Field walks and residential camps reported improvements in mood, perceived restoration, stress, or well-being.[33][34] | These outcomes may be valuable, but they are not substitutes for executive-function measures. |
Program Design Options for Organizations
Organizations should present nature immersion as a program intended to support attention recovery, well-being, and meaningful engagement, while treating executive-function improvement as a hypothesis to evaluate. The available evidence does not establish an optimal dose, a walking-over-sitting advantage, or one superior activity.[35][36][37]
- Use accessible, authentic nature where feasible. Offer green or blue spaces that participants can realistically reach and use. Include accessible routes, resting facilities, handrails where needed, weather protection, clear information about hazards, and alternatives for mobility or sensory needs.[38][39][40]
- Offer structured choice. Provide options such as walking, quiet observation, gardening, or other active and passive forms of contact. Treat repeated exposure, quiet observation, reduced competing demands, and reflective activities as plausible implementation options or hypotheses, not as demonstrated ingredients for executive-function improvement.[41][42]
- Test dose rather than prescribe it. Record session duration, frequency, timing, setting, activity, and whether exposure is direct or indirect. Prior studies include exposures from 1 minute to 4 hours, with 10 to 15 minutes most common, but this pattern does not identify an optimal dose.[43][44]
- Match facilitation to participant needs. Provide orientation, safety support, practical assistance, and professional support when required. Access alone does not guarantee participation, particularly for people with mobility impairments.[45][46]
- Separate restoration from cognitive training. If the program includes reflection, problem-solving, navigation, or group challenges, identify these as additional program components rather than assuming that nature exposure alone caused any cognitive change.
How to Evaluate a Program
Use a controlled or randomized design when feasible, with pre-program, immediate post-program, and follow-up assessments. The comparison could be an indoor activity, an urban setting, or a matched non-nature program, provided the organization records what participants actually do in each condition. This is important because the outdoor-learning review found substantial variation in comparison groups, study quality, and outcome measures, and could not calculate pooled effect sizes.[47][48][49]
- Primary cognitive outcomes: Use validated task-based measures of sustained and selective attention, working memory, inhibition, and cognitive flexibility. Pre-specify which process each task is intended to measure, following the process-specific logic emphasized by the 2018 review.[50]
- Secondary outcomes: Measure mood, perceived restoration, stress, nature connection, and well-being separately from cognitive performance. Field and camp studies show that these outcomes can change even when executive function is not directly measured.[51][52]
- Implementation data: Record attendance, exposure duration, activity type, setting, weather, accessibility supports, facilitator contact, and participant engagement. Such reporting helps determine whether outcomes depend on dose, context, or delivery rather than on “nature” as a single undifferentiated treatment.[53]
- Interpretation: Report task-specific effects and null results separately. Do not convert faster responses, improved mood, or greater nature connection into claims of improved executive function unless the relevant executive task actually improves.
The key test is not simply whether participants feel restored after camp. It is whether a prespecified executive or attention measure improves more than in a credible comparison condition, persists beyond the immediate session, and does so without being explained by practice effects, mood changes, social contact, exercise, reduced phone use, or other camp features.
Conclusion
Nature immersion is a plausible way to support short-term sustained or selective attention and broader restoration, and the 2016 review identified positive effects on a small set of attention-related tasks. However, the evidence does not justify saying that immersion camps generally improve executive function. Real-world camp studies so far provide stronger evidence for well-being, stress, nature connection, and psychological functioning than for working memory, inhibition, or cognitive flexibility.
For organizations, the most defensible approach is to build flexible, accessible programs with intentional nature contact, offer activity choices, measure exposure carefully, and evaluate cognitive outcomes directly against a comparison condition. Repeated exposure, quiet observation, reduced competing demands, and reflective structure may be reasonable design hypotheses, but they should be tested rather than marketed as proven mechanisms of executive-function improvement.
Let's look at alternatives:
- Modify the query.
- Start a new thread.
- Remove sources (if manually added).
AI in Education: What the Evidence Really Says
Let's look at alternatives:
- Modify the query.
- Start a new thread.
- Remove sources (if manually added).
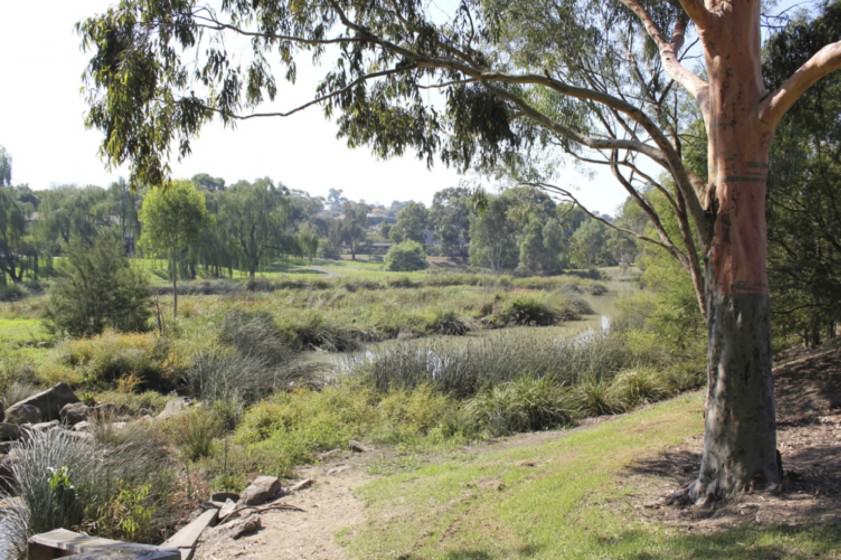
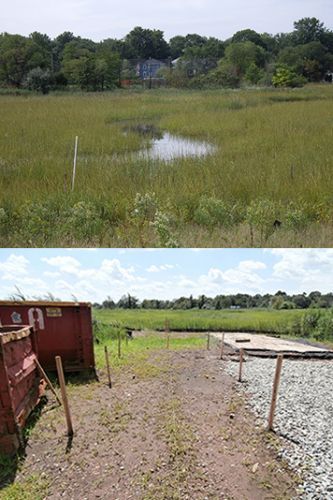
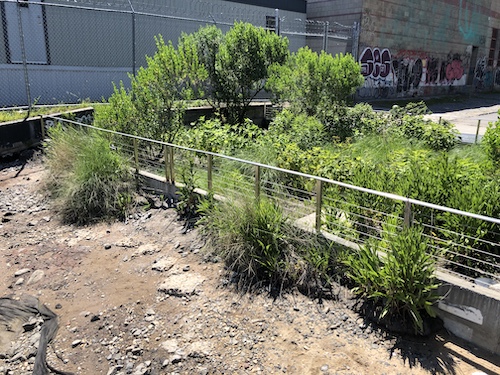
Waterfronts Reimagined for Rising Water



Let's look at alternatives:
- Modify the query.
- Start a new thread.
- Remove sources (if manually added).
How do probabilistic population forecasts differ from scenario-based projections?. Compare conditional scenario pathways with predictive distributions, explaining what each format can and cannot say about likelihood. Include the UN approach, the Italy 2065 example, prediction intervals, and the implications for infrastructure and policy decisions.
Probabilistic Forecasts versus Scenario-Based Projections
The central difference is interpretive: a scenario-based projection traces the consequences of specified assumptions, while a probabilistic forecast represents uncertainty across possible futures and can support statements about probabilities. A scenario pathway can say, “if these fertility, mortality, and migration assumptions hold, this population path follows.” It cannot, by itself, say how likely that pathway is. A predictive distribution can describe ranges of outcomes and attach probabilities to events, but those probabilities depend on the forecasting model and its assumptions.
The attached sources establish this distinction through the contrast between traditional assumption-driven projections and newer probabilistic work, while noting that the Istat release does not provide the full formal definitions or technical machinery for conditional pathways, predictive distributions, likelihood, or prediction intervals.[1][2][3]
What Each Format Can and Cannot Say
| Format | What it can say | What it cannot say without additional modelling |
|---|---|---|
| Conditional scenario pathway | Shows the population consequences of a specified set of assumptions, such as a selected future path for fertility, survival, and migration. | It does not, merely by being labelled “low,” “medium,” “high,” or “median,” establish that the pathway has a particular probability of occurring. |
| Predictive distribution | Represents uncertainty over possible future population values or paths and can support statements such as the probability that population rises or falls, or that an outcome lies within a stated interval. | It does not provide certainty. Its probabilities are conditional on the model, data, and assumptions used to generate the distribution. |
| Interval | Summarizes a range of plausible or model-generated outcomes at a stated coverage level. | The label matters. The Istat source reports a “90% confidence interval,” not a formally defined “prediction interval,” and does not explain the technical interpretation of either term in detail.[4] |
Thus, a central scenario and a probabilistic range should not be treated as interchangeable. The scenario is a conditional pathway. The distribution is an uncertainty statement. A scenario may be useful for exploring consequences under coherent assumptions even when no likelihood is assigned; a predictive distribution is useful when decision-makers need probability-weighted information, provided the model’s uncertainty is credible.
The United Nations Approach
The UN traditionally produced projections from assumptions about future fertility, survival, and international migration rates. Under those assumptions, the “Medium” projection supplied a single future population value, without formally expressing the uncertainty around that value in probabilistic terms.[5]
In July 2014, the UN issued official probabilistic population projections for every country through 2100. These projections quantified uncertainty associated with future fertility and mortality trends worldwide.[6] The significance of this change is not simply that the UN published more high and low cases. It was a shift toward distributions of possible outcomes, allowing uncertainty to be communicated in probabilistic form rather than only through separate assumption-based pathways.
The attached Istat material does not describe the UN model’s technical treatment of scenario pathways, conditional probabilities, predictive distributions, or interval construction. Those concepts should therefore be used here as an interpretive distinction, not presented as a technical summary of the UN methodology beyond what the attached sources document.[7]
Italy in 2065: A Central Pathway alongside Uncertainty
Istat’s Italy example illustrates why the distinction matters. Under its median scenario, Italy’s population is projected to decline from 60.7 million in 2016 to 58.6 million in 2045 and 53.7 million in 2065.[8] The 53.7 million figure is best read as the outcome along a central scenario pathway, not as a guaranteed or uniquely most-likely future simply because it is called “median.”
- When demographic uncertainty is included, the 2065 population range is 46.1 million to 61.5 million.[9]
- Istat reports a 7% chance of a population increase by 2065.[10]
- The projected decline is regionally uneven: the South and Islands decline throughout the projection period in the median scenario, while the Centre-North begins to decline only from 2045.[11]
- By 2065, the Centre-North is projected to contain 71% of residents, compared with 66% in the base period, while the South and Islands fall from 34% to 29%.[12]
- For 2065 fertility, Istat reports a 90% confidence interval of 1.25 to 1.93 children per woman. The source also expects average annual net migration to exceed 150,000, while not excluding a negative long-term outcome.[13][14]
The Italy release therefore combines a central median pathway with uncertainty ranges and an explicit empirical probability. However, it uses the term 90% confidence interval, not “prediction interval,” and the attached material does not supply the formal definitions needed to equate the two or explain their exact statistical construction.[15][16]
Implications for Infrastructure and Policy
A single scenario is often easier to communicate and use in a plan, but it can encourage false precision. Planning only for Italy’s 53.7 million central outcome could leave capacity insufficient if the result approaches 61.5 million, or create excess capacity if it approaches 46.1 million.[17] A probabilistic forecast makes that exposure visible, although it does not eliminate uncertainty or guarantee that the stated probabilities will be correct.
- Stress-test long-lived investments. Roads, transit, hospitals, schools, housing, utilities, and other infrastructure should be examined against multiple population outcomes rather than one central pathway. The reported uncertainty in fertility, survival, and migration supports flexible, staged, or adaptable planning, although Istat does not prescribe a specific infrastructure method.[18]
- Match decisions to the information format. Use conditional scenarios to ask what follows if a particular demographic pathway occurs. Use predictive distributions when the decision requires probability statements, such as assessing the chance that demand exceeds a capacity threshold.
- Plan geographically, not only nationally. Italy’s projected movement toward the Centre-North means that national totals cannot substitute for regional analysis. Transport, healthcare, schools, housing, and utilities may face different pressures across regions.[19]
- Make assumptions explicit. Fertility, survival, and migration are sources of uncertainty, so policies should identify which assumptions drive the result and monitor whether observed trends are moving toward or away from the planning pathway.[20][21]
- Avoid probability overclaiming. A scenario label does not establish likelihood. Conversely, a probability from a predictive distribution is a model-based statement, not a fact independent of the model.
The practical implication is a robust-planning approach: retain central scenarios for communication and coherent “what if” analysis, but test major decisions against the broader distribution of possible futures and against regional redistribution. This is an interpretation of the reported figures and uncertainty, rather than a specific planning procedure set out by the Istat release.[22]
Conclusion
Scenario-based projections and probabilistic forecasts answer different questions. A conditional scenario says what population would result under specified assumptions; it does not, on its own, assign likelihood. A predictive distribution describes uncertainty across outcomes and can support probability statements, such as Istat’s reported 7% chance of population increase, but those statements remain conditional on the forecasting framework. The UN’s 2014 move to official probabilistic projections marked a shift toward explicitly quantifying uncertainty, while Italy’s 2065 example shows why policy should not confuse a median pathway with a guaranteed future. Infrastructure and policy decisions should therefore use scenarios to explore consequences and distributions to assess risk, with both national uncertainty and regional change considered.
Let's look at alternatives:
- Modify the query.
- Start a new thread.
- Remove sources (if manually added).
Which game engine should you learn first? Score 1 point for each answer that
Let's look at alternatives:
- Modify the query.
- Start a new thread.
- Remove sources (if manually added).
The Well at the World's End - Story Book

The Well Beyond Grief



Let's look at alternatives:
- Modify the query.
- Start a new thread.
- Remove sources (if manually added).
Five Urban Nature Escapes





Let's look at alternatives:
- Modify the query.
- Start a new thread.
- Remove sources (if manually added).
A history of screen time policies in public education. Trace policies from computer labs of the 1980s to pandemic era remote learning. Analyse policy shifts, outcomes, and future proposals.
A History of Screen-Time Policies in Public Education
Public-school technology policy has moved through four broad phases: limited access through computer labs, connectivity and technology-literacy programs, one-to-one device expansion, and emergency mass remote learning during COVID-19. The central policy question consequently changed from whether schools could provide access to computers to how much screen use improves learning, for whom, and under what safeguards.
This report traces that trajectory, distinguishes documented policy milestones from analytical synthesis, and assesses outcomes in learning, equity, implementation, and student well-being. The evidence supports neither unconditional expansion nor blanket rejection of educational technology. It supports purposeful use, strong teacher preparation, equitable infrastructure, public accountability, and non-screen alternatives.
1. From Computer Labs to Networked Schools, 1980s to 1990s
In the 1980s, personal computers became established in schools, usually in dedicated computer labs rather than as devices available continuously in every classroom. Educational software emphasized drill, practice, and recall, so screen exposure was generally episodic and tied to scheduled lab sessions rather than embedded across the school day.[1]
Federal policy at this stage emphasized access, infrastructure, software quality, and teacher support. The 1983 report A Nation at Risk recommended computer science as one of five new basics for high-school graduation requirements. The Office of Technology Assessment's 1988 Power On! report identified adequate access, sustained educator support, improved software, and practitioner-focused research as conditions for effective K-12 technology use. Late-1980s and early-1990s OTA reports repeatedly emphasized professional development for teachers.[2][3][4]
The 1990s expanded the policy problem from placing computers in schools to connecting schools and defining meaningful technology literacy. Internet connectivity, email, instant messaging, and online information extended communication and learning beyond classroom walls.[5] Major policy documents reviewed for the period included Connecting K-12 Schools to the Information Superhighway, Education and Technology: Future Visions, Teachers and Technology: Making the Connection, and the 1996 Department of Education report Getting America's Students Ready for the 21st Century: Meeting the Technology Literacy Challenge.[6][7]
A major infrastructure milestone was E-Rate. Established under the Telecommunications Act of 1996 and implemented by the FCC in 1997, the program used Universal Service Fund support to discount telecommunications, Internet access, and internal connections for eligible schools and libraries, with particular attention to rural and economically disadvantaged communities.[8][9] Discounts ranged from 20% to 90%, depending on poverty levels, and rural applicants could receive higher discounts.[10] The FCC reports that only 14% of U.S. K-12 classrooms had Internet access when E-Rate was established, although the supplied material does not quantify the program's causal effect or provide a specific post-program percentage.[11][12]
Analytical synthesis: The 1980s and 1990s policy model treated technology primarily as scarce infrastructure. Screen time was constrained by the number of machines, lab schedules, connectivity, and teacher capacity. By the late 1990s, policymakers increasingly recognized that hardware and Internet connections alone did not constitute meaningful access.[13]
2. From Access to Integration, 2000s to 2010s
In the early 2000s, online courses, digital content, data-driven assessment, and STEM initiatives became more common.[14] Broadband and cable increasingly replaced dial-up by the late 1990s, while web-based services became a principal route for distributing lessons and curricula. Online lessons, university courses, and MOOCs expanded during the 2000s and 2010s, with renewed enthusiasm around MOOCs peaking in 2012.[15][16] At the K-12 level, online learning expanded and standardized testing increasingly moved onto digital platforms.[17]
Federal policy also shifted from simply building capacity toward transforming teaching and learning. The 2000 National Technology Education Plan, e-Learning: Putting a World-Class Education at the Fingertips of All Children, emphasized professional development and the relationship between technology capabilities and instruction rather than assuming that technology was automatically transformative.[18][19] The No Child Left Behind Act of 2001 mandated a national education technology plan to guide effective technology use for high-quality teaching and learning.[20]
The 2010 National Education Technology Plan formalized five goals: learning, assessment, teaching, infrastructure, and productivity.[21][22] It called for engaging technology-supported learning, meaningful assessment, connected teaching and technology-based professional learning, broadband and wireless access inside and outside school, and more efficient educational processes.[23] Its equity provisions explicitly included low-income and minority students, students with disabilities, English-language learners, and students in rural and frontier schools.[24] The plan recommended that every student and educator have at least one Internet-access device, connectivity, and software for research, communication, multimedia creation, and collaboration both in and beyond school.[25]
By the 2010s, mobile devices, learning-management systems, cloud collaboration tools, and one-to-one initiatives were widespread, shifting digital learning from an optional addition to a routine part of classroom life.[26] A one-laptop-per-child program illustrates the limits of an access-first approach: it increased computer and Internet access but did not improve educational attainment or post-secondary enrollment.[27]
Sweden offers a second example of policy reassessment. In 2009, it replaced textbooks with screens in an effort to modernize instruction, and later proposed reversing that direction by returning toward paper textbooks.[28][29] The example does not prove that screens universally harm learning, but it demonstrates that governments may reconsider intensive digitalization when expected educational benefits do not clearly justify the costs or tradeoffs.
3. The Pandemic: Remote Learning as Emergency Policy
Before COVID-19, digital learning had expanded but had not fully displaced in-person schooling. By 2019, only 21% of public high schools offered any online classes, and most students still learned in physical schools, although blended learning was becoming more common.[30] In 2020, school closures forced most schools online and exposed unequal access to devices and high-speed Internet, as well as concerns about privacy, online proctoring, and course quality.[31]
The outcome evidence is substantially more negative than the earlier promise of technology-enabled transformation. U.S. eighth-grade NAEP mathematics scores fell 8 points between 2019 and 2022, equivalent to 0.2 standard deviations or approximately 0.6 years of schooling.[32] Declines occurred across grades, were generally larger in mathematics than reading, began early in the pandemic, and showed no apparent recovery in the period covered by the report.[33] A systematic review of more than 40 studies worldwide estimated average pandemic learning loss at 0.14 standard deviations, or about 0.4 years of schooling.[34]
The mode and amount of remote instruction mattered. Achievement declines increased as the share of the 2020-21 school year spent in remote instruction increased. Districts with more in-person instruction experienced smaller declines than districts relying most heavily on fully virtual instruction; hybrid instruction reduced losses relative to fully virtual learning but did not eliminate them.[35] The Richmond Fed attributes the disruption partly to reduced skill accumulation, less instructional time, and weakened peer effects and peer-group formation.[36]
The burden was unequal. Disadvantaged students were more likely to experience cancellations, had less access to remote-learning resources, and relied more heavily on schools to obtain those resources.[37] The pandemic increased inequality in mathematics and reading outcomes through unequal exposure to closures, unequal effects of remote and hybrid instruction, reduced positive peer spillovers, and lower-income parents' more limited capacity to support learning at home.[38] Online searches for school and parent learning resources doubled nationally by April 2020, but increases were largest in higher-income areas with better Internet access and fewer rural schools.[39]
Well-being evidence is narrower than a general mental-health assessment. One cited analysis found that teen suicides declined in March 2020, remained low through summer, and rose in fall 2020 as many schools returned to in-person instruction; returning from online to in-person schooling was associated with a 12% to 18% increase, with bullying victimization proposed as a contributing factor.[40] This finding should not be interpreted as evidence that remote learning generally improved well-being, because it concerns a specific outcome and period rather than overall student mental health.
4. What the Evidence Says About Screen Time
The evidence does not support treating all screen exposure as educationally equivalent. An analysis of 2017 NAEP data found that heavier digital-device use in language-arts classes was associated with lower reading-comprehension scores, particularly among fourth graders compared with eighth graders. Reading projects were associated with better comprehension, while practice of discrete skills such as vocabulary or fluency was associated with lower comprehension.[41][42]
UNESCO reviews cited in the supplied guidance identify small to medium positive effects from technology in areas such as inclusion of children with disabilities, continuity during emergencies, access to resources, content creation, and engagement. The same evidence warns that intensive use can reduce performance and increase disruption.[43] Schools also choose products for cost, ease of use, accessibility, and maintainability more often than for strong evidence of improved learning.[44]
Implementation is therefore a policy variable, not an administrative afterthought. Effective integration depends on planning, infrastructure, technical support, and collaboration among colleagues, while teachers report concerns about safety, displacement of other educational experiences, excessive use, and whether technology use is worthwhile.[45][46] Policies should specify appropriate use, responsibilities, professional development, evaluation, privacy, accessibility, and interoperability, and should be developed and revised with teachers, families, students, leaders, and staff.[47][48][49]
5. Future Policy Proposals
Policy proposal and analytical synthesis: The policy problem in the 2010s shifted from scarcity to saturation. Once many students had near-continuous access to connected devices, the relevant question became how to prevent unnecessary screen exposure while preserving the instructional benefits of digital tools. A coherent policy should require a non-screen alternative for major digital tasks, so that access to a device is not equivalent to a requirement to spend more time looking at one. This is a proposed framework, not a directly sourced finding.
- Use a purpose-and-evidence test: every required screen activity should identify the learning objective, explain why digital delivery is better than paper or in-person instruction, and be evaluated for learning, distraction, accessibility, privacy, and maintenance. The need for clearer evaluation and effectiveness criteria is supported by current educational-technology guidance.[50][51]
- Avoid assuming that one device per child is always the best allocation. Dedicated computer labs or shared computer carts could provide access for coding, media production, research, and specialized software while reducing continuous individual-screen expectations. This proposal is directly identified as an alternative to universal individual screens.[52]
- Preserve teacher-led and in-person learning as the default context for technology, using screens for clear educational purposes rather than as a replacement for instruction. UNESCO recommends managing screen time, preventing devices from obstructing learning, and avoiding replacement of in-person teacher-led instruction.[53]
- Adopt context-sensitive phone rules. UNESCO supports restrictions when phones distract from learning or threaten well-being, while allowing educational, disability-related, or health-related exceptions rather than imposing one identical ban everywhere.[54][55]
- Treat access as more than hardware. Funding should address broadband, internal networks, technical support, teacher preparation, and home access, while monitoring who can actually use the system. The 2010 NETP and E-Rate model both connect technology policy to infrastructure and equity rather than devices alone.[56][57][58]
- Build public digital infrastructure with accountability, interoperability, safety, and teacher support. The UNESCO, UNICEF, and ITU Charter presents public digital platforms as core infrastructure that should complement schools and teachers, remain publicly accountable, and provide teachers with training, tools, and resources.[59][60][61]
- Plan for continuity without treating remote learning as a full substitute for school. Pandemic evidence favors preparedness for connectivity and accessible learning resources, but also shows that fully virtual instruction was associated with larger achievement declines than more in-person models.[62]
Post-pandemic recovery policy should also include additional instructional time, high-quality teaching, tutoring, and individualized or small-group instruction. These approaches are identified as promising for addressing learning loss, although large-scale tutoring faces staffing, scheduling, cost, and quality-control challenges.[63]
Conclusion
The history of public-school screen policy is not a simple march from analog schooling to digital progress. It is a sequence of policy corrections: computer labs addressed scarcity; Internet and E-Rate addressed connectivity; national technology plans addressed teacher capacity, equity, and system integration; one-to-one programs pursued ubiquity; and pandemic remote learning revealed the educational and social costs of treating digital access as a substitute for school.
The next phase should therefore be selective rather than maximalist. Public education should guarantee meaningful digital access, but judge technology by learning outcomes and inclusion, not device counts. It should protect teacher-led and social learning, offer paper and other non-screen routes for substantial work, involve families and educators in policy design, and reassess universal-screen assumptions in light of evidence from one-to-one programs, Sweden's textbook reversal, and pandemic learning losses.[64][65][66]
Let's look at alternatives:
- Modify the query.
- Start a new thread.
- Remove sources (if manually added).
The Well at the World's End - Short Movie
Transcript
The Well at the World's End /media/short_movies/10880/299882_movie.mp4 Poster: /media/short_movies/10880/299882_poster.png
Let's look at alternatives:
- Modify the query.
- Start a new thread.
- Remove sources (if manually added).