Descobreix Pandipedia
Un directori creixent de respostes útils seleccionades per la comunitat de Pandi. Cerca a la col·lecció o explora els darrers descobriments.
2272 entrades disponibles
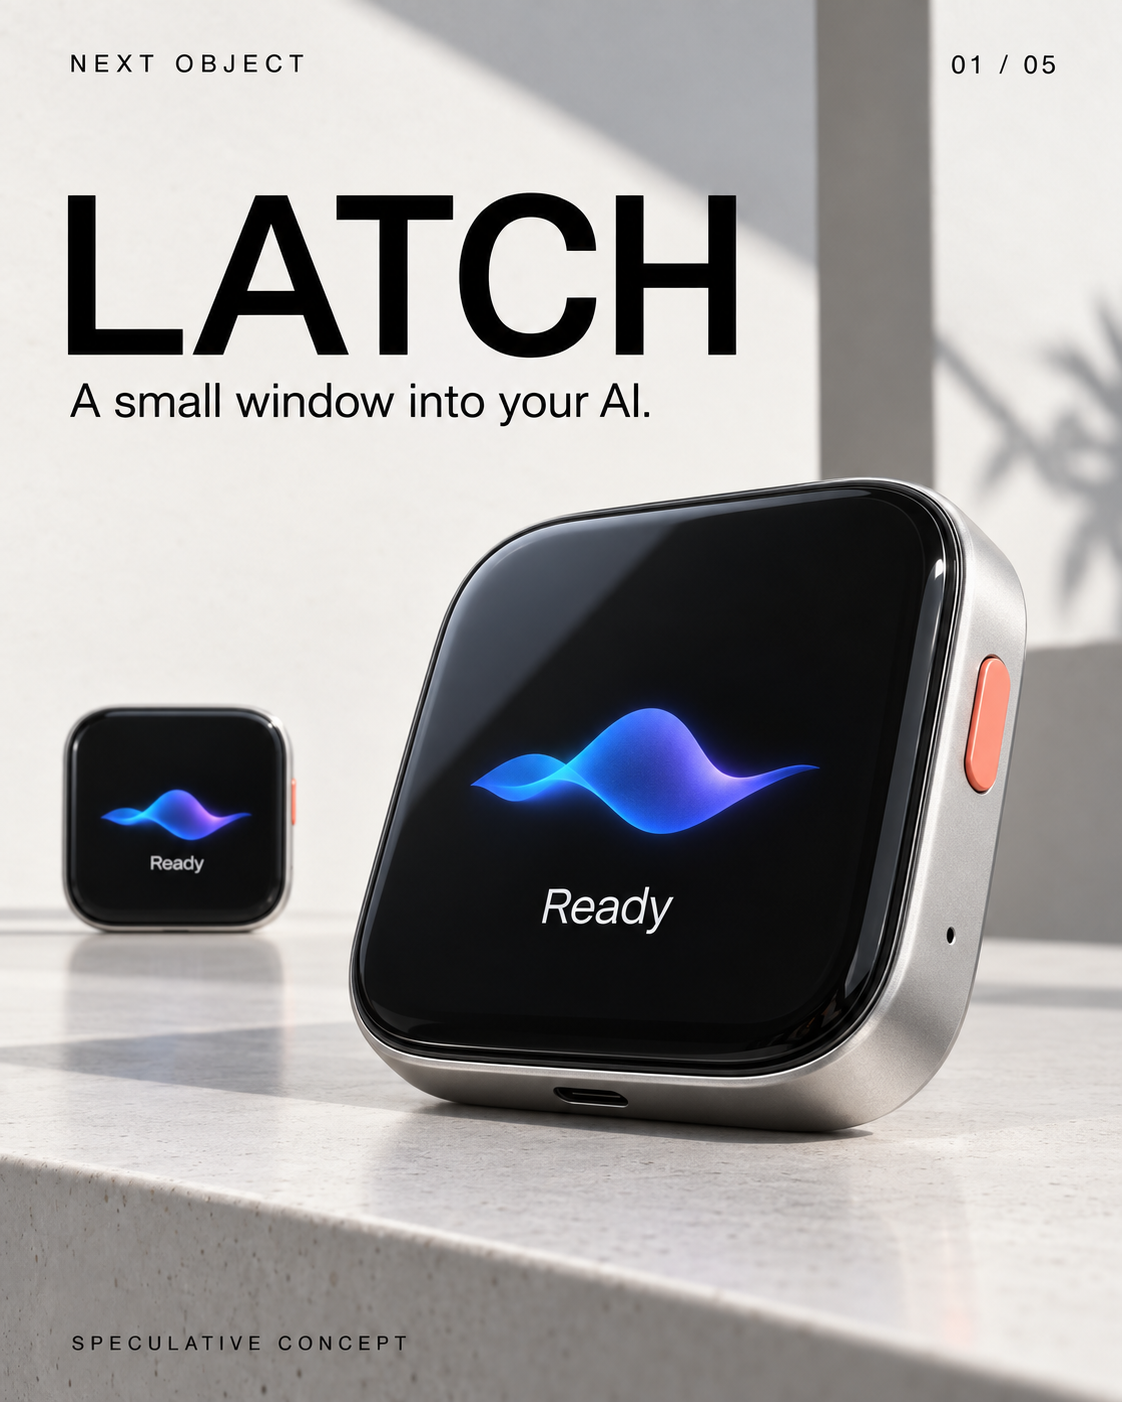
LATCH: a small window into your AI
 1/5
1/5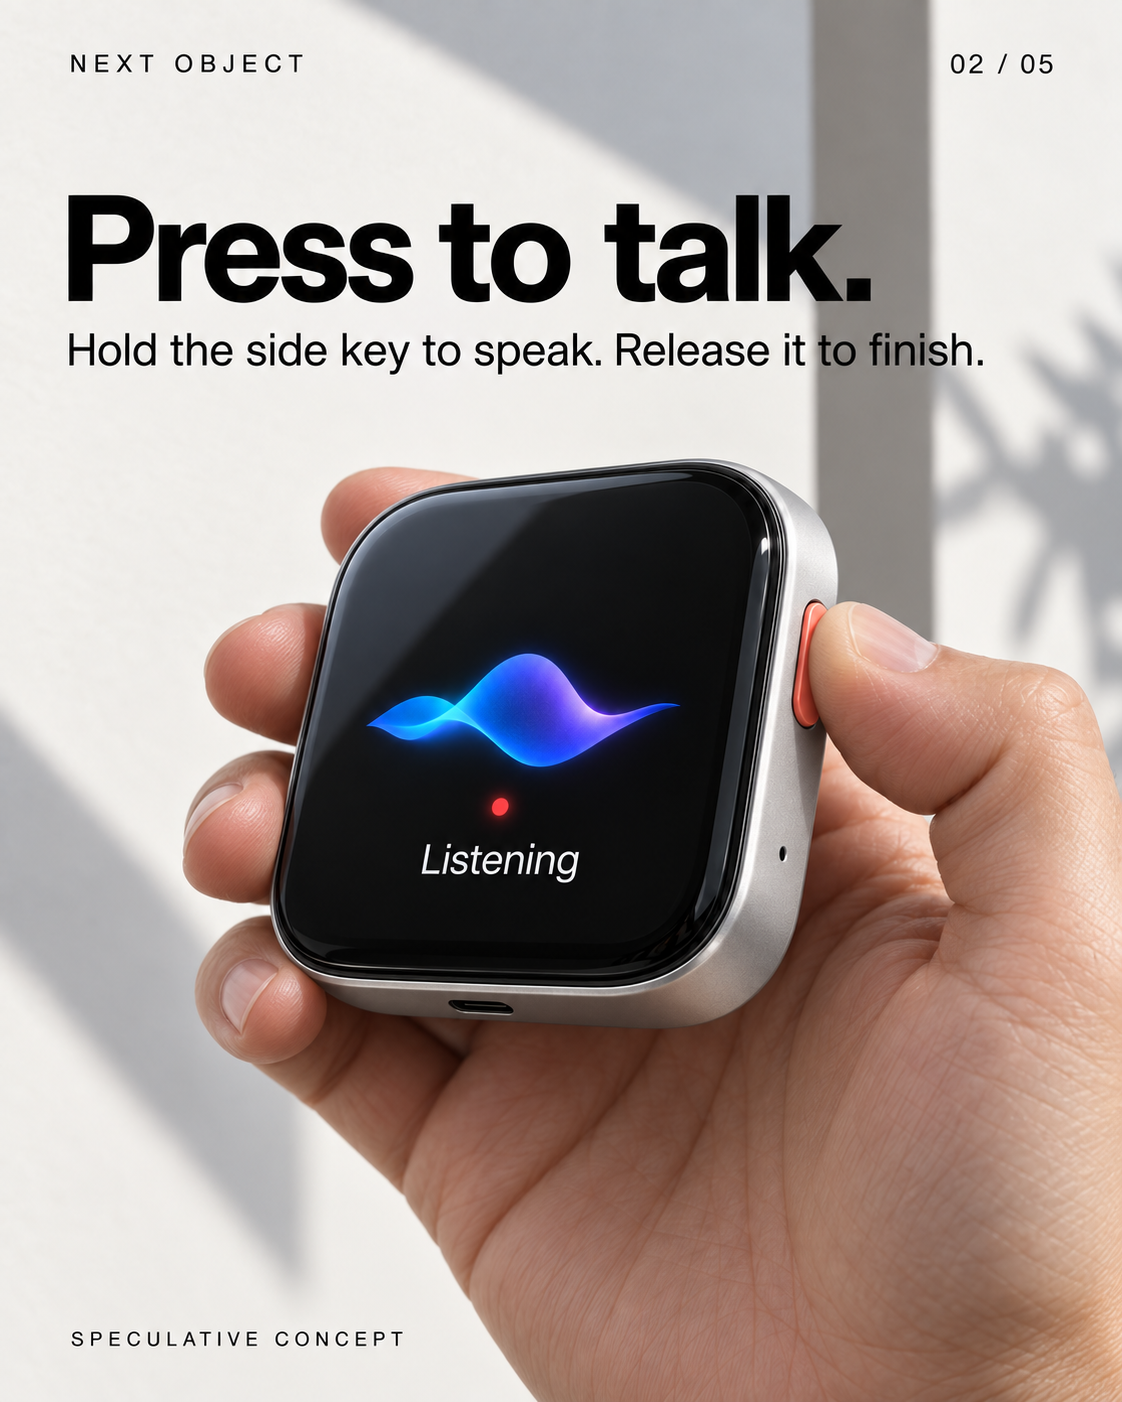
Llegeix el text de les diapositives
- LATCH
A small window into your AI.
- Press to talk.
Hold the side key to speak. Release it to finish.
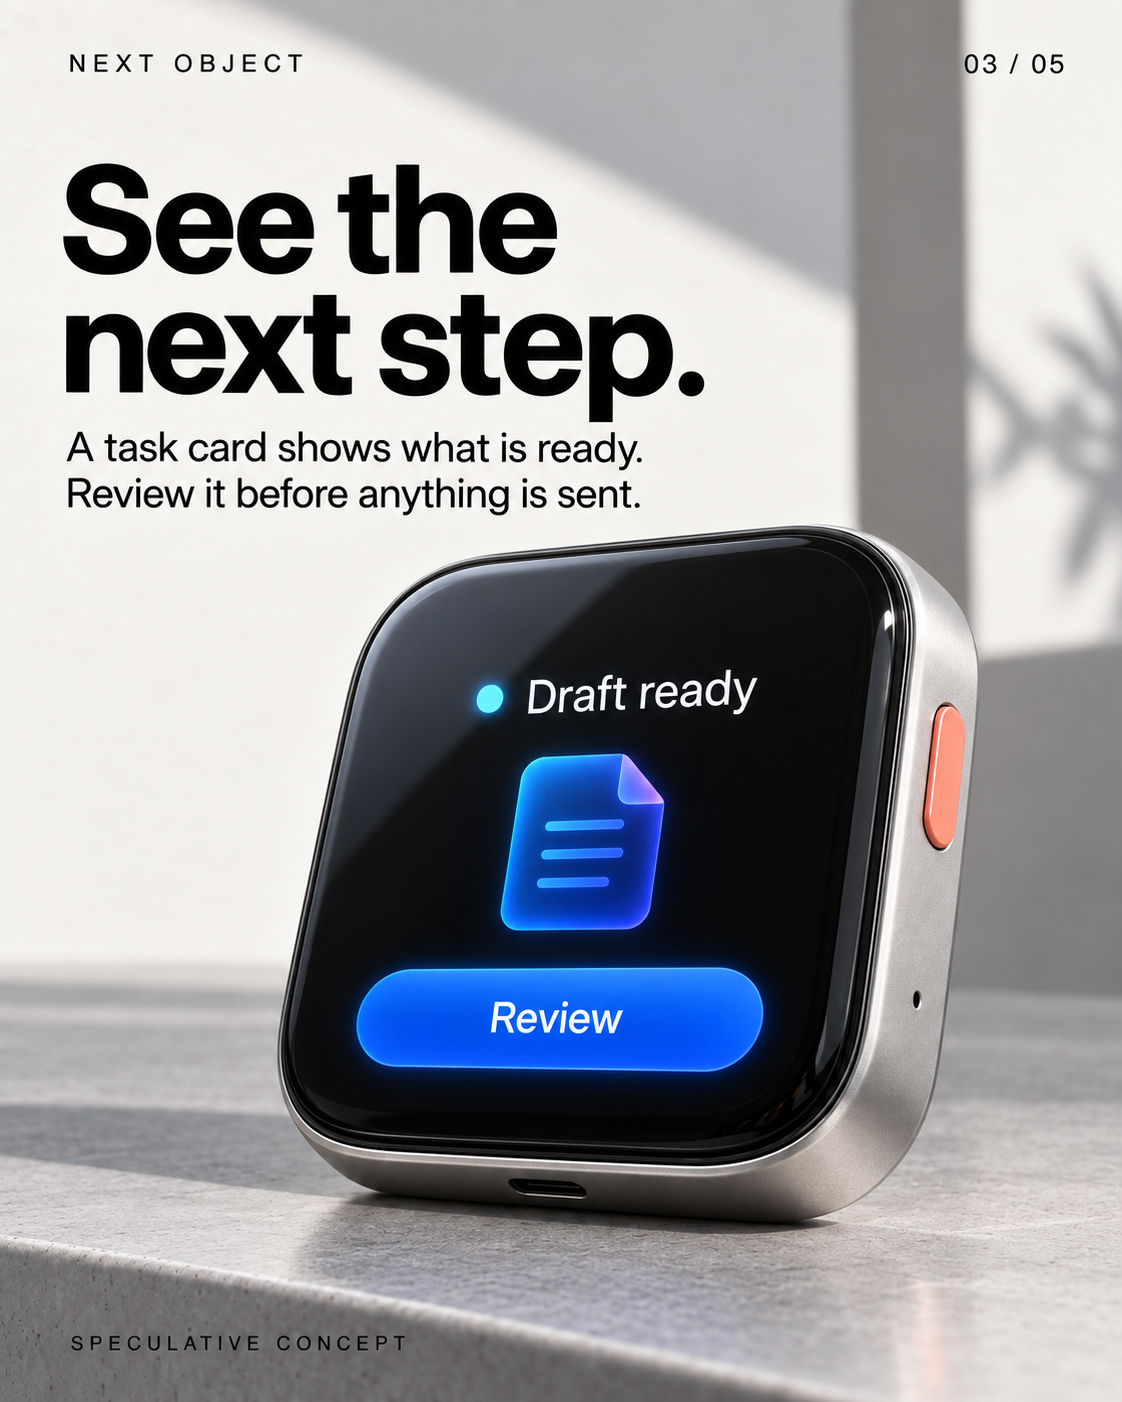
- See the next step.
A task card shows what is ready. Review it before anything is sent.
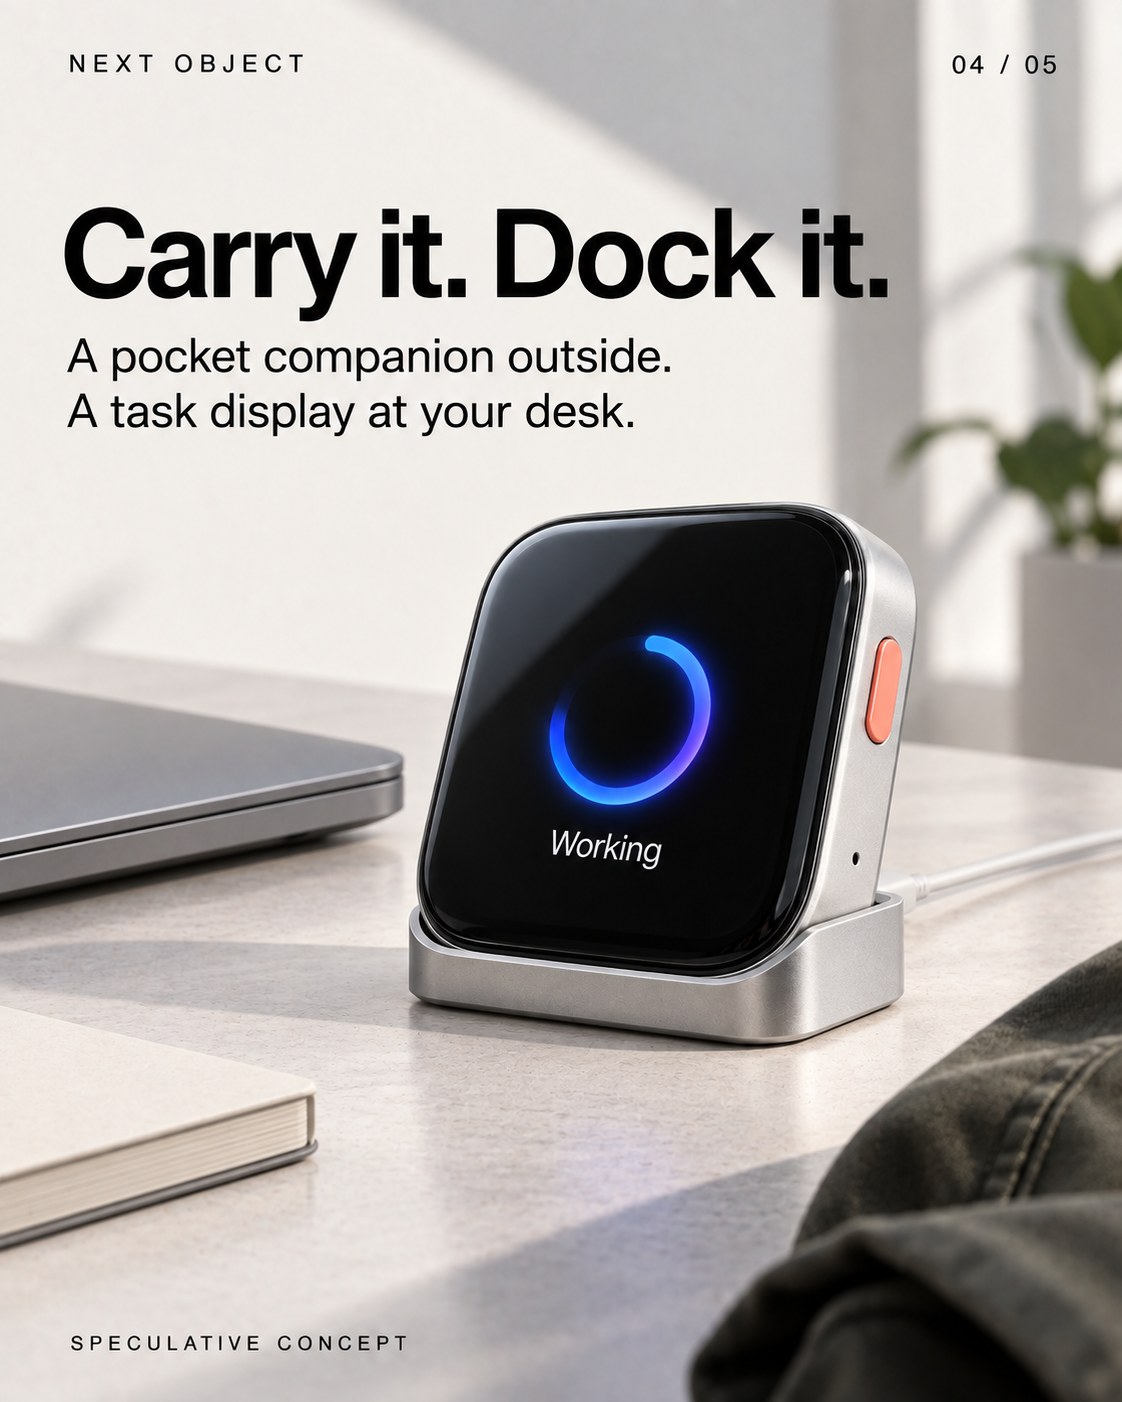
- Carry it. Dock it.
A pocket companion outside. A task display at your desk.
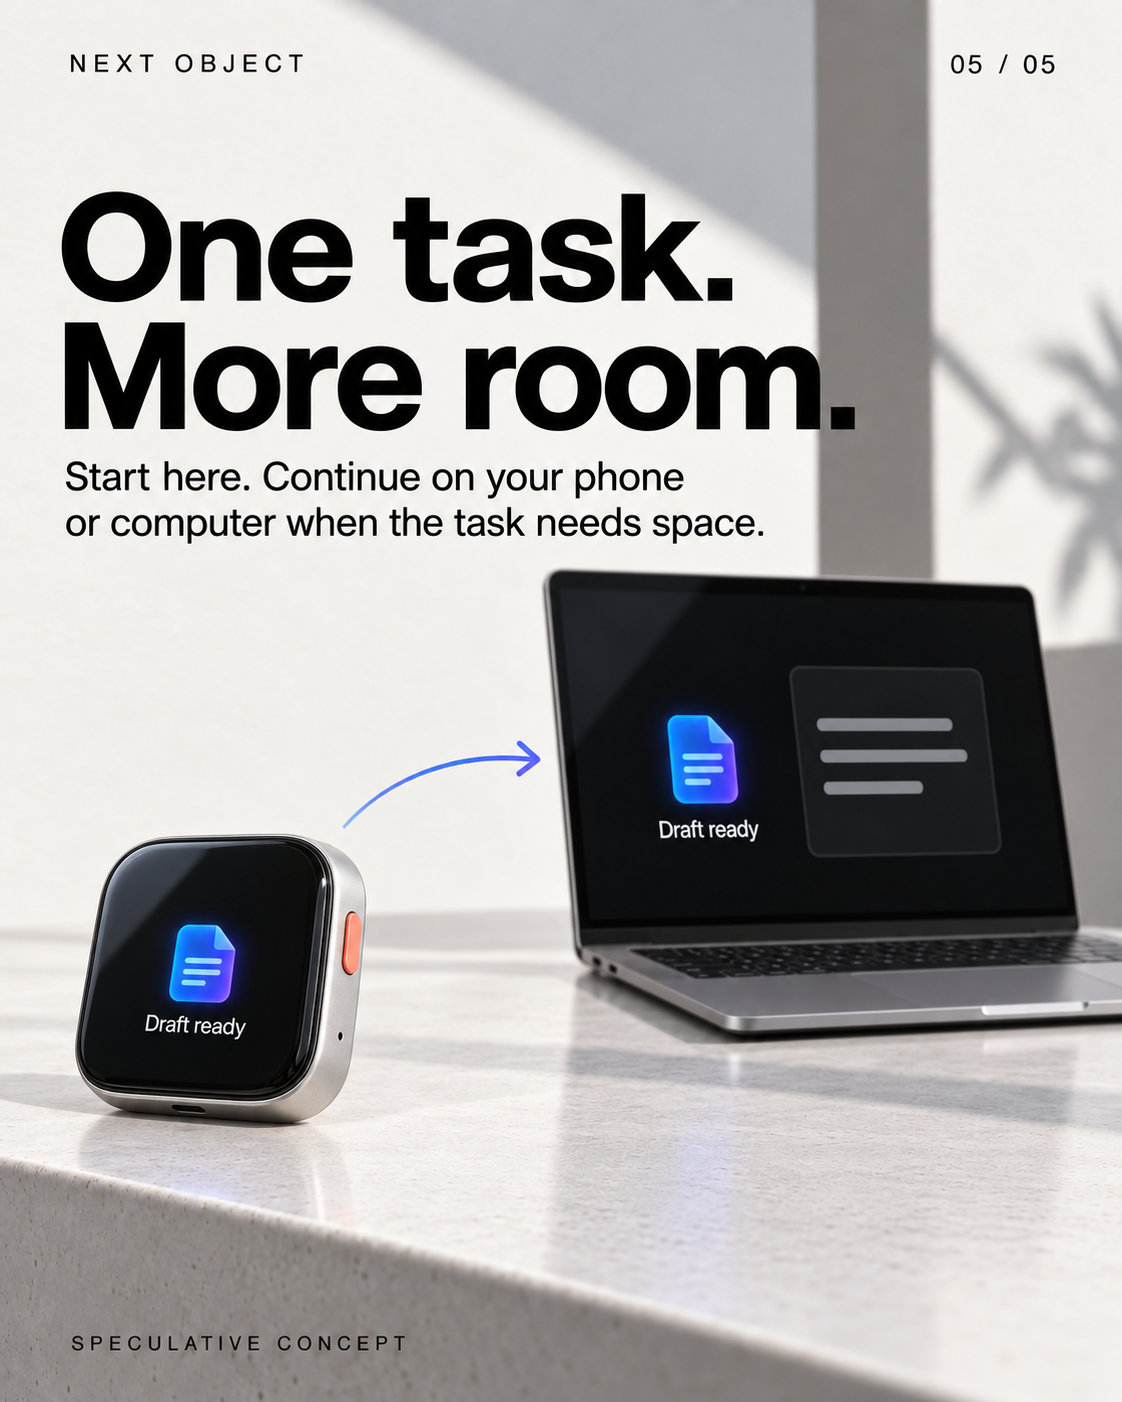
- One task. More room.
Start here. Continue on your phone or computer when the task needs space.
Veiem alternatives:
- Modifica la consulta.
- Inicia un nou fil.
- Elimina les fonts (si s'han afegit manualment).

Lunch in Sync: A Simple Guide to the Afternoon Dip
Transcripció
Want steadier energy through your lunch break? Your body’s daily timing system naturally brings a dip in alertness in the early afternoon, so lunch is not always the cause. A high-carbohydrate lunch may deepen that dip, but evidence that meal composition reliably causes sleepiness is limited. Try keeping meals reasonably regular and planning lunch about four to five hours after breakfast. If lunch is running late, a snack with protein, carbohydrate, and fat may help prevent excessive hunger. If you feel sleepy after eating, a gentle walk or a short nap may help you feel more alert. There is no established perfect lunch time here: use a regular rhythm that fits your day, and remember that an afternoon dip can happen even when lunch is not to blame.
Veiem alternatives:
- Modifica la consulta.
- Inicia un nou fil.
- Elimina les fonts (si s'han afegit manualment).
Building resilient rural economies through human-AI collaboration in agriculture
Building resilient rural economies through human-AI collaboration in agriculture
Human-AI collaboration in agriculture means combining digital tools with farmers’ local knowledge, practical skills, and trusted human advice. The evidence points to a workable approach: use precision tools to improve input decisions, train farmers and advisers to apply them, and share costs where individual farms cannot justify the investment. The available research is stronger on resource-use and economic benefits than on quantified yield gains or net employment effects.
Where precision tools can help
Precision farming uses data and targeted equipment to make field operations more specific to location and conditions. GPS guidance and machine section control can reduce overlap or missed areas, while variable-rate application, remote sensing, sensors, and yield monitoring help farmers adjust inputs to differences within a field.[1][2][3]
- Use inputs more efficiently: A U.S. study reports estimates associated with precision-agriculture adoption of 5% less water use and 7% less fuel use. These are resource-use estimates, not yield or profit guarantees.[4][5]
- Target specific field tasks: AI-enabled cameras and sensors can identify weeds for selective spraying, with the intended benefit of reducing herbicide use; the available findings do not quantify the resulting savings.[6][7]
- Keep people in the decision loop: An AgAID example describes drawing on expert operational rules to guide robotic pruning, then logging cuts to support growers’ harvest and labor planning. This illustrates a collaborative design in which expert knowledge informs automation and the resulting records support later decisions.[8]
Adoption remains a constraint: the cited U.S. report says 27% of farms or ranches used precision-agriculture practices to manage crops. The research also identifies broadband, financing, and evidence of return on investment as practical conditions that can affect wider use.[9]
Skills, advice, and shared investment
Tools alone do not create effective collaboration. Farmers need practical training and help getting started, while extension services can combine digital delivery with trusted human advice. In one cited survey, 56% of farmers consulted technical agronomists, compared with 6% who cited AI chatbots as an advice source.[10][11]
Training is more likely to fit local needs when farmers can learn from peers with similar conditions and see tools demonstrated in practice. In a randomized Tanzania trial, farmers offered SMS advice and five-person discussion groups were more likely than controls to adopt practices discussed in those groups; engagement declined in later rounds, highlighting the need to sustain participation.[12][13][14][15]
For farms unable to afford equipment individually, cooperative investment can spread the cost and broaden access. The research describes pooled ownership and scheduled sharing of machinery, joint purchasing, leasing with payments aligned to seasonal income, and technical assistance or cooperative-friendly financing to support cooperative development.[16][17][18][19]
What the impact numbers do and do not show
The available evidence does not establish a numerical average increase in crop yields or a net number of rural jobs created by precision agriculture or agricultural AI. It does provide some useful, narrower indicators, which should not be mistaken for those missing outcomes.
| Outcome | What the research reports | How to interpret it |
|---|---|---|
| Water and fuel use | Estimated 5% less water use and 7% less fuel use associated with precision-agriculture adoption in a U.S. study.[20][21] | Resource-use estimates, not direct measures of yield, income, or job creation. |
| Farm economics | A meta-analysis of 85 studies and 1,472 farm observations reports significant average economic benefits, but the available summary gives no effect size.[22][23] | Evidence of average economic benefit, without a usable magnitude here; results may vary by setting. |
| Crop yield | The supplied review material discusses yield prediction but provides no pooled numerical estimate of yield gains from adopting precision agriculture or AI.[24][25] | Do not treat prediction capability as proof of a yield increase. |
| Farm-service employment | Higher precision-ag adoption across U.S. states was weakly associated with more farm-equipment technicians per farm and higher technician wages. Adoption explained about one-quarter of cross-state variation, but the analysis does not establish causation or jobs created per adoption increase.[26] | A limited association, not a net employment estimate. |
| Technician workforce scale | The article reports about 36,830 U.S. farm-equipment mechanics and service technicians in 2023.[27][28] | An occupation count, not the number of jobs attributable to precision farming. |
For rural economies, the practical implication is to track outcomes locally rather than assume that technology automatically raises yields or employment. Measure yields, input use, farm costs, equipment utilization, training participation, and relevant jobs before and after adoption; the sources reviewed here do not supply a general yield or net-job effect that can substitute for that local evaluation.
Key takeaway
A resilient approach pairs targeted precision tools with farmer expertise, ongoing hands-on learning, and cooperative or lease-based access to equipment. Reported water and fuel savings and average economic benefits are promising, but the available evidence does not quantify typical yield gains or net agricultural employment effects; those should be measured directly in each local program.[29][30][31][32][33]
Veiem alternatives:
- Modifica la consulta.
- Inicia un nou fil.
- Elimina les fonts (si s'han afegit manualment).
What are the cognitive benefits of learning a second language after 60?
Learning a second language after the age of 60 offers several notable cognitive and structural brain benefits. Research shows that foreign language acquisition in older adults stimulates brain regions linked to executive functions [1] and can help preserve gray matter integrity [2].
While learning a language later in life may not lead to full bilingualism, it provides cognitive advantages that overlap with those of lifelong bilingual speakers [3]. Specifically, studies tracking older adults through intensive foreign language programs report improvements in executive cognitive functions alongside measurable structural changes in the brain [4]. These benefits include enhanced memory retention, greater cognitive flexibility, and increased gray matter volume in regions associated with cognitive reserve [5][6].
For practical ways to start learning, structured programs and courses—such as beginner English courses used in clinical interventions [7], community classes, and video-based or human-taught language courses—provide accessible entry points for older learners looking to build mental acuity.
Would you also like to know more about how executive functions change during these language-learning programs?Resposta completada. Hi ha una opció de seguiment disponible.
Veiem alternatives:
- Modifica la consulta.
- Inicia un nou fil.
- Elimina les fonts (si s'han afegit manualment).
The Hidden Carbon Cost of Your Gaming Rig
Transcripció
Your gaming rig uses electricity while you play, and a few settings can cut waste without changing the fun. A mid-range gaming computer typically draws about 300 to 500 watts during use, while a gaming monitor often uses 25 to 75 watts. The longer they run, the more electricity they use. In the United States, the average electricity supply produces about 348 grams of carbon dioxide per kilowatt-hour, though the amount varies by region. Start with easy changes: cap frames per second at your monitor’s refresh rate, use a balanced power plan, lower screen brightness to a comfortable level, and set the monitor to sleep when you step away. You can also test a lower graphics-card power limit and keep it only if your games still feel right. Small adjustments reduce energy your setup does not need to use, while leaving you in control of the experience.
Veiem alternatives:
- Modifica la consulta.
- Inicia un nou fil.
- Elimina les fonts (si s'han afegit manualment).
From Sleep Laboratories to Smart Rings: A History of Sleep Technology
From Sleep Laboratories to Smart Rings: A History of Sleep Technology
Sleep technology has moved from measuring brain signals in laboratories to tracking multiple body signals with small consumer devices, and is now exploring ways to monitor sleep without contact. The shift has made sleep data easier to collect, but it has not made every estimate equally reliable: consumer wearables can be useful for broad patterns, while they do not replace a clinical sleep study.[1][2][3]
This history follows three linked changes: researchers learned to identify sleep states, clinical tests added breathing measurements and standardized scoring, and consumer devices made tracking more convenient. The final step, contactless radar, could reduce the burden of wearing a device, though its clinical role remains unproven in the evidence available here.
The laboratory foundation: making sleep measurable
Polysomnography (PSG) is a sleep study that records several physiological signals together. Its roots lie in electrical brain recording: Caton recorded electrical activity from animal brains in 1875, and Berger reported human electroencephalography (EEG) in 1929. In 1937, Loomis described EEG features of non-rapid-eye-movement sleep and classified it into five stages, establishing that sleep could be studied through measurable patterns rather than treated as one uniform state.[4]
The addition of eye-movement recording helped researchers distinguish rapid-eye-movement (REM) sleep from other sleep states. Researchers studied eye movements in 1951; Aserinsky and Kleitman described REM sleep in 1953, and Dement and Kleitman reported repeating NREM–REM cycles and a staging system in 1957. PSG developed from EEG and other electrophysiological recordings, first as a research method and later in clinical practice.[5][6]
Standardization made those observations more comparable. In 1968, Rechtschaffen and Kales published a manual establishing sleep-stage terminology, techniques, and scoring rules. Meanwhile, respiratory inductance plethysmography (RIP), which measures breathing-related movement, was introduced in the 1960s. These developments widened sleep measurement from brain and eye activity to breathing, helping PSG become a principal diagnostic method for sleep-related breathing disorders by the 1980s.[7][8][9]
| Period | Milestone | Why it mattered |
|---|---|---|
| 1875–1929 | Caton recorded animal-brain electrical activity; Berger reported human EEG.[10] | Established electrical recording as a way to study brain activity. |
| 1937–1957 | Researchers classified NREM sleep, identified REM sleep, and described repeating sleep cycles.[11] | Sleep states could be distinguished using measured signals. |
| 1960s–1968 | RIP broadened respiratory measurement; the Rechtschaffen–Kales manual standardized scoring.[12][13] | Added breathing information and common rules for interpreting sleep stages. |
| 1980s | PSG emerged as a chief diagnostic method for sleep-related breathing disorders.[14] | A research approach became central to clinical diagnosis. |
The overall change was not simply more sensors: combining and standardizing signals made it possible to describe sleep in a consistent way and connect sleep-stage observations with respiratory problems. Later professional guidance continued to incorporate RIP, including an update in the American Academy of Sleep Medicine’s 2012 manual.[15]
Consumer tracking: convenience, more signals, mixed reactions
Consumer tracking shifted the goal from a detailed overnight clinical assessment to collecting sleep-related data at home over time. Watch-like actigraphy devices in the 1990s used accelerometers to record movement over days or weeks. They inferred that stillness meant sleep and movement meant wakefulness, so quiet wakefulness could be misclassified as sleep.[16]
Fitness bands and smartwatches extended that approach. Many combine movement sensors with optical photoplethysmography (PPG), which uses changes in blood flow to estimate heart rate. Depending on the device, apps may present sleep duration, stages, or scores; some newer smartwatches also offer proxy ECG or blood-oxygen measurements. Smart rings move multisensor tracking from wrist to finger: Oura is described as combining nighttime movement with pulse rate, heart-rate variability, respiratory rate, and body temperature.[17][18][19]
The change in consumer attitudes is best described as interest accompanied by uncertainty, rather than a simple embrace of ever more data. A 2026 Norwegian survey of 1,002 adults found that 46% had used a sleep app, most commonly on a smartwatch. Among users, about 48% said they learned something about their sleep, 43% found apps useful, and 15% said their sleep improved. At the same time, 18% felt more worried about sleep and 14% felt something was wrong with their sleep; users with insomnia reported more negative effects. These were self-reported, cross-sectional findings, so they do not show that tracking caused either benefit or worry.[20]
More signals do not automatically mean more accurate results. The available account says consumer devices estimate sleep duration and stages, but stage estimates are less dependable than sleep-versus-wake estimates. Consumer trackers should therefore be understood as tools for observing personal patterns, not substitutes for clinical PSG.[21][22]
What may come next: contactless radar
Contactless radar sensors are designed to monitor a sleeper from beside the bed, without a wearable. The described system emits electromagnetic pulses and detects body movement, using those signals to estimate breathing rate and broad sleep patterns. A study protocol planned to assess measures such as sleep onset, waking time, sleep midpoint, and total sleep duration; the evidence supplied does not establish direct measurement of heart-related motion by that system.[23]
The potential advantage is lower nightly effort: once installed, a bedside sensor may collect data without requiring the user to put on a device or manually start each recording, and could support longer-term collection. But the evidence is still limited. The source reports that Sleepscoremax and Somnofy had been validated against PSG without providing accuracy figures or detailed agreement results. The adolescent study described is a feasibility protocol comparing radar with actigraphy and sleep diaries, not a PSG validation study. Questions about reliability, how consumer estimates are calculated, and bedroom privacy also remain.[24]
Conclusion: easier tracking, not yet a replacement for diagnosis
The history of sleep technology is a progression from laboratory recordings that made sleep stages visible, to standardized clinical tests that included breathing, to convenient wearables that estimate sleep from multiple signals. Smart rings are one expression of that consumer shift. Contactless radar may extend it by removing the need to wear a sensor, but its future value depends on demonstrating reliable performance and earning user trust. For now, convenience and clinical certainty remain distinct goals: consumer devices can help people follow patterns, while diagnosis still calls for appropriate clinical assessment.[25][26][27][28][29]
Veiem alternatives:
- Modifica la consulta.
- Inicia un nou fil.
- Elimina les fonts (si s'han afegit manualment).
Which programming language was used to write the initial version of the PyTorch
The initial version of the PyTorch library grew out of Torch, an open-source machine learning library whose core was written in C and C++[1][2]. Around 2011, Torch was rewritten as Torch7, which used the Lua scripting language for its frontend with a C and C++ backend[3]. In mid-2016, developers at Facebook AI Research refactored it to create a Python-first framework, resulting in PyTorch[4].
As a quick historical tidbit, Torch was originally created in 2002 by the Idiap Research Institute[5][6] before its eventual transition into the Python-based PyTorch ecosystem in 2016[7].Would you also like to know how PyTorch's dynamic computation graphs work?Resposta completada. Hi ha una opció de seguiment disponible.
Veiem alternatives:
- Modifica la consulta.
- Inicia un nou fil.
- Elimina les fonts (si s'han afegit manualment).
From quests to classroom projects
From quests to classroom projects
A quest gives learners a goal, a sequence of challenges, and a reason to keep going. For classroom projects, borrow that structure to make the learning target clear, progress visible, and the work meaningful, while keeping the academic objective more important than the game mechanics.
| Quest element | Assignment-design equivalent | What students experience |
|---|---|---|
| Clear objective: a defined goal and criteria for success help focus effort.[1] | State what students should learn or demonstrate, align project tasks and assessment criteria to it, and make success criteria visible.[2][3] | They know what they are working toward and how their work will be judged. |
| Feedback loop: challenge, response, feedback, and another try.[4] | Break the project into checkpoints; use teacher or peer feedback to identify next steps, then give students time to revise before the final submission.[5][6][7] | They can see progress, learn from mistakes, and improve their work rather than discovering problems only at the end. |
| Narrative stakes: a mission or story connects tasks and makes the work feel relevant.[8][9] | Frame the project around an authentic problem, audience, or driving question; give connected checkpoints a shared purpose.[10][11][12] | They understand why the tasks belong together and who or what the final work is for. |
A practical brief: name the learning goal; set a mission or real-world problem; list the steps, constraints, and success criteria; schedule feedback-and-revision checkpoints; and allow meaningful choices, such as format or route to the outcome. For example, a reading project could ask students to solve a mystery by analyzing passages and citing evidence. Keep points, badges, or story elements secondary to demonstrating the intended skill.[13][14][15][16][17]
Veiem alternatives:
- Modifica la consulta.
- Inicia un nou fil.
- Elimina les fonts (si s'han afegit manualment).
What accessibility features are becoming standard in modern video games?
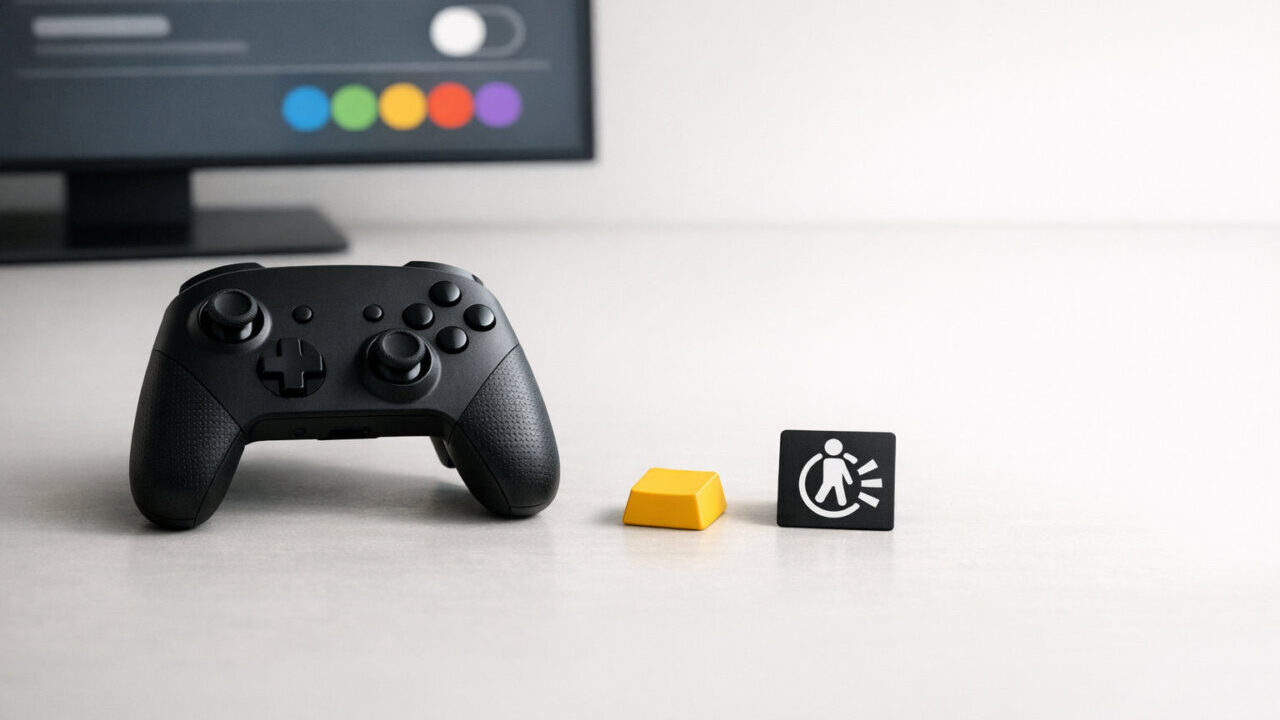
Modern video games are increasingly incorporating accessibility features as a core design standard rather than an optional extra[1][2]. Emerging norms and standard options include:
- Customizable controls: Full button remapping, adjustable analog stick and triggers sensitivity, dead zone customization, toggle versus hold commands, and support for adaptive controllers[3][4].
- Color-blind modes: Tailored visual settings and customized palettes to support players with color blindness and low vision[5].
- Sign-language avatars and communication support: Advanced auditory and communication options include signing[6], along with text-to-speech, speech-to-text, and visual sound indicators for directional cues[7].
- Additional emerging norms: Scalable fonts, customizable subtitles with speaker tags, screen reader compatibility, and adjustable difficulty or assist sliders[8][9].
Adoption is being driven by several key industry guidelines and cross-industry initiatives. Notably, the Entertainment Software Association (ESA) launched the Accessible Games Initiative (AGI), introducing 24 standardized accessibility tags across auditory, gameplay, input, and visual categories to provide clear information on storefronts[10]. Regulatory frameworks such as the Twenty-First Century Communications and Video Accessibility Act (CVAA) in the U.S. have also expanded requirements for accessible communication services and user interfaces in video games[11][12].
Would you also like to know which platforms currently lead in displaying standardized accessibility tags?Resposta completada. Hi ha una opció de seguiment disponible.
Veiem alternatives:
- Modifica la consulta.
- Inicia un nou fil.
- Elimina les fonts (si s'han afegit manualment).
Why conjunction plans meant long stays—and opposition plans short ones
Historical conjunction- and opposition-class missions were proposed architectures, not missions that flew. The trade was straightforward: conjunction plans spent much longer at Mars to keep both interplanetary legs relatively low-energy, while opposition plans shortened the stay but required a more demanding, propellant-intensive leg.[1][2][3]
| Plan | Trajectory in plain language | Approximate duration | Propellant trade |
|---|---|---|---|
| Conjunction-class | Low-energy trip from Earth to Mars, a long wait at Mars, then a low-energy return trip.[4] | About 500 days at Mars; about 1,000 days for the full expedition.[5] | Lower propellant demand than a purely propulsive opposition-class plan.[6] |
| Opposition-class | One low-energy transfer and one high-energy transfer, with a brief Mars stay between them.[7] | Typically under 30 days at Mars; about 600 days for the full mission.[8] | The high-energy leg raises propellant demand; all else equal, a purely propulsive version could require more than 10 times the propellant of a purely propulsive conjunction-class expedition.[9] |
Veiem alternatives:
- Modifica la consulta.
- Inicia un nou fil.
- Elimina les fonts (si s'han afegit manualment).