Découvrir Pandipedia
Un répertoire grandissant de réponses utiles sélectionnées par la communauté Pandi. Cherchez dans la collection ou parcourez les dernières découvertes.
2322 entrées disponibles

Why Doomscrolling Keeps Pulling You Back
Transcription
Doomscrolling is the habit of repeatedly consuming upsetting news, even when it leaves you feeling worse. Why is it so hard to stop? Threat-focused attention pulls us toward negative information because it feels important to monitor. Uncertainty can add pressure: checking again may feel like a way to find answers or regain control. When updates arrive unpredictably, the next scroll might bring something new, which can keep the checking cycle going. People often call this a dopamine loop, but that label should be used cautiously. It does not by itself prove a standalone addiction mechanism. The practical response is to create boundaries. Choose specific times for news, disable breaking-news notifications, set a time limit, and use reliable sources instead of endless feeds. When anxiety rises, pause and name what you are feeling. Then replace the scroll with an intentional activity, such as a walk. If distress or sleep disruption persists, consider seeking professional help. The goal is not to ignore the world. It is to stay informed without letting uncertainty control your attention.
Examinons les alternatives :
- Modifier la requête.
- Démarrer une nouvelle conversation.
- Supprimer des sources (si elles ont été ajoutées manuellement).
Ocean-Based Renewable Energy: Performance, Impacts, and Commercial Readiness
Ocean-Based Renewable Energy: Performance, Impacts, and Commercial Readiness
Ocean energy offers three distinct pathways to electricity: tidal-stream turbines extract predictable currents, wave-energy converters capture surface-wave motion, and ocean thermal energy conversion (OTEC) uses the temperature difference between warm surface water and cold deep water. The central finding is that tidal and wave technologies have reached early commercialization, while OTEC remains primarily a research and demonstration technology. The evidence base is uneven: performance data are more developed than environmental and commercial-scale evidence, and the supplied sources do not support firm sector-wide commercialization dates.
For readers comparing technologies, the most important distinction is between conversion efficiency and capacity factor. Conversion efficiency measures how much available or captured resource becomes electricity. Capacity factor measures actual output over time against continuous operation at rated power. None of the supplied sources reports a numerical capacity factor for tidal stream, wave energy, or OTEC, so qualitative claims about predictability or baseload potential should not be treated as capacity-factor measurements.[1][2]
1. Performance comparison
| Technology | Reported performance | What the number does not mean | Main technical limitations |
|---|---|---|---|
| Tidal stream | No numerical turbine or overall electrical efficiency is reported. Tidal flows generally need to reach about 1.5 to 2 m/s for practical extraction.[3] | No numerical capacity factor is reported. Predictable tides are not equivalent to a measured capacity factor.[4] | Survivability, corrosion, subsea transmission, installation and maintenance, limited infrastructure, and limited practical validation of proposed design improvements remain barriers.[5][6] |
| Wave energy | PNNL reports 20% to 30% efficiency for current wave-energy converters, but the source does not define the measurement boundary.[7][8] | No numerical capacity factor is reported. Claims of 200% to 300% improvement in power-conversion efficiency and an 18% output increase are relative technology-study results, not fleet efficiency or capacity factor.[9][10][11] | Variable input, conversion-chain losses, resonance control, storm loading, moorings, corrosion, offshore maintenance, and grid or storage requirements complicate deployment.[12][13] |
| OTEC | A 7.4% figure is the maximum theoretical Carnot efficiency for the stated warm and cold-water temperatures, not measured net-plant efficiency.[14][15] A separate 66% figure applies to hydraulic energy recovery in a subsystem, not to whole-plant thermal-to-electric conversion.[16] | No numerical capacity factor is reported. Stable ocean temperatures indicate baseload potential, not demonstrated capacity factor.[17] | Low thermodynamic efficiency, heat-transfer losses, heat-exchanger and working-fluid requirements, deep-water intake challenges, and large open-cycle turbines limit performance.[18][19] |
These figures are therefore not directly rankable. The wave percentage is the only reported current-converter efficiency range, but its boundary is unspecified. The OTEC percentage is an ideal thermodynamic ceiling, while the tidal figure is a resource threshold rather than an efficiency result. More comparable evidence would require common definitions, long-duration operation, and independently reported net electrical output.
2. Environmental impacts and mitigation
Ocean energy has a potential climate benefit because it can replace carbon-emitting electricity, and the IPCC characterizes ocean energy as having no operational greenhouse-gas emissions and potentially low lifecycle emissions. However, low operational emissions do not mean zero local ecological risk.[20]
| Technology | Reported environmental issues | Evidence and mitigation position |
|---|---|---|
| Tidal stream | Potential stressors include altered hydrodynamics and sediments, habitat modification, collisions with moving components, underwater noise, and electromagnetic fields. Large arrays could affect migration patterns more than individual pilot devices.[21][22] | Evidence is strongest here but still limited for commercial-scale arrays and cumulative effects. Recommended measures include pilot monitoring, project-specific environmental assessment, regional baseline studies, marine spatial planning, stressor-receptor analysis, and adaptive management.[23][24][25][26] |
| Wave energy | The supplied material does not report specific effects on animals, habitats, sediments, or coastal processes for wave converters.[27] | The IPCC describes ocean energy generally as having relatively low environmental impacts, but local effects remain under evaluation as deployment increases. The supplied sources identify general permitting, research, regulatory, and marine-space-allocation practices rather than a wave-specific monitoring protocol.[28][29][30] |
| OTEC | The supplied sources do not provide OTEC-specific findings on intake, discharge, thermal changes, nutrient transport, or ecological benefits.[31][32] | OTEC environmental literature and deployment experience are described as limited. No OTEC-specific mitigation or monitoring practice, such as intake protection or thermal-plume assessment, is documented in the supplied evidence.[33] |
The practical implication is that tidal projects currently face the clearest requirement for site-specific ecological evidence, while wave and OTEC assessments should not be interpreted as proof of negligible impact. For all three technologies, environmental conclusions should remain installation-specific and should account for cumulative effects as deployment expands.[34][35]
3. Commercialization status and plausible timelines
The available evidence supports a maturity hierarchy rather than a calendar forecast. Tidal and wave energy are in early commercialization. Tidal designs are beginning to converge, whereas wave developers have not converged on a dominant design and are increasingly targeting smaller niche markets. OTEC remains at small scale with limited deployments, led mainly by research institutes and universities because investment returns remain uncertain.[36][37][38][39][40]
- Tidal stream: limited commercial deployments and first arrays are the nearer-term pathway, especially in coastal and island settings. The sources provide no firm commercialization year.[41][42]
- Wave energy: smaller devices may first serve coastal, island, and offshore niche markets. The sources provide no dated commercialization forecast.[43]
- OTEC: continued research and demonstration are more defensible expectations than broad commercial rollout. No commercialization date is stated.[44][45]
- All three face high installation, operating, and maintenance costs, difficult grid connections, weathering, immature supply chains, complex regulation, uncertain environmental effects, and challenges securing finance and insurance.[46][47][48][49]
The broad pathway is full-scale prototypes producing electricity, followed by first arrays, larger construction and operating experience, and eventual competition with alternative generation. The sources caution that progress and cost reduction have been slower than expected, so assigning dates beyond this sequence would exceed the evidence.[50][51][52][53]
4. Representative projects worldwide
The project record is geographically broad but unevenly documented. The examples below are representative documented projects, not a complete ranking. Capacity, developer, and status are shown only where the supplied sources provide them.
| Technology | Project and location | Scale and developer | Status or significance |
|---|---|---|---|
| Tidal | MeyGen, Scotland | 86 MW consented capacity, with potential expansion to 398 MW; Phase 1 has four 1.5-MW turbines.[54] | Phase 1 has operated since 2018.[55] |
| Tidal | Dragon 12, Faroe Islands | 1.2-MW kite-type device developed by Minesto.[56] | Full-scale, grid-connected, and operating as an installation.[57] |
| Tidal | Bluemull Sound Shetland Tidal Array, United Kingdom | Managed by Nova Innovation; capacity not stated.[58] | Full-scale, grid-connected, and active.[59] |
| Tidal | FlowWatt, Raz Blanchard, Normandy, France | 17-MW pre-commercial tidal farm; HydroQuest is among the developers.[60] | Supported by French government and EU Innovation Fund grants; operating status is not stated.[61] |
| Wave | Pelamis, Orkney, Scotland and Portugal | 2.25-MW wave-power plant deployed off Portugal in 2008; developer not stated in the supplied text.[62] | Installed at EMEC and deployed off Portugal; the source reports a commercial sale.[63] |
| Wave | Wavepiston v1, Gran Canaria, Spain | 30-kW full-scale oscillating-wave-surge-string-attenuator developed by Wavepiston.[64] | First two full-scale converter segments were deployed at PLOCAN in 2024.[65] |
| Wave | OE-35, Oahu, Hawai‘i | 500-kW oscillating-water-column device developed by OceanEnergy Group’s U.S. subsidiary.[66] | Deployed off Hawai‘i in July; the supplied record does not specify the year or subsequent operating status.[67] |
| OTEC | Kavaratti OTEC Powered Desalination Plant, Arabian Sea, India | Full-scale project managed by the Indian National Institute of Ocean Technology; capacity not stated.[68] | Grid-connected and active in the OpenEI project database.[69] |
| OTEC | Mini-OTEC, off Hawai‘i | Operated by a Lockheed team; approximately 50 kW gross and 15 kW net.[70] | Historical demonstration operated in 1979.[71] |
| OTEC | OTEC-1, off Hawai‘i | U.S. Department of Energy converted Navy tanker test platform; capacity not stated.[72] | Deployed in 1980 to test heat exchangers and other closed-cycle components.[73] |
The supplied sources do not support a complete worldwide list of leading projects. In particular, the broader commercialization review names no tidal or wave project, and identifies only an unnamed OTEC facility in Hawai‘i. The project databases and technology surveys fill that gap with examples, but several entries lack current status, capacity, or developer information, so comparisons should be treated as indicative rather than definitive.[74][75][76][77]
Key takeaways
- Tidal stream is the most commercially advanced of the three in the supplied evidence, with operating grid-connected projects and several larger projects progressing, but its numerical efficiency and capacity factor remain poorly documented.[78][79][80][81]
- Wave energy has a reported current-converter efficiency range of 20% to 30%, but no numerical capacity factor and no dominant device architecture. Its most defensible near-term role is in selected coastal, island, and offshore niches.[82][83][84]
- OTEC offers theoretically continuous generation but faces the weakest thermodynamic and commercial position: its 7.4% value is an ideal upper bound, and documented deployment remains limited and small-scale.[85][86][87][88]
- Environmental conclusions should be calibrated to evidence. Tidal impacts and monitoring needs are relatively well characterized, while wave and OTEC evidence remains too limited for technology-specific claims of either safety or harm.[89][90][91]
- No supplied source justifies a firm commercialization year for any of the three technologies. The credible forecast is staged deployment, learning, and cost reduction rather than a dated mass-market arrival.[92][93][94][95]
Examinons les alternatives :
- Modifier la requête.
- Démarrer une nouvelle conversation.
- Supprimer des sources (si elles ont été ajoutées manuellement).
Gemini 9 to Gemini 12: Learning to Work in Space
Examinons les alternatives :
- Modifier la requête.
- Démarrer une nouvelle conversation.
- Supprimer des sources (si elles ont été ajoutées manuellement).
Climate Adaptation Finance: Turning a Funding Gap into Resilience
Climate Adaptation Finance: Turning a Funding Gap into Resilience
Climate adaptation finance pays for measures that help people, infrastructure, ecosystems, and livelihoods withstand climate impacts such as floods, droughts, storms, heat, and sea-level rise. The central challenge is not simply raising more money: finance must also reach vulnerable communities, reduce investment risk, and demonstrate whether projects actually improve resilience.
The scale of the gap is substantial. Developing countries may need roughly US$310–365 billion per year by 2035, compared with about US$26 billion in international adaptation finance in 2023. This implies an annual shortfall of approximately US$284–339 billion, or needs around 12–14 times current flows.[1][2]
1. Where the gap is greatest
The burden is uneven. East Asia and the Pacific, and Latin America and the Caribbean, have the highest absolute modelled adaptation costs among the regions identified in UNEP’s assessment.[3] Low-income countries face the greatest burden relative to their economies: estimated adaptation costs equal about 3.5% of GDP, compared with 0.7% for lower-middle-income countries and 0.5% for upper-middle-income countries.[4]
The largest modelled cost categories are river-flood protection, infrastructure, and coastal protection.[5] Agriculture and food, and water supply, are priorities across regions, while reported adaptation actions also concentrate on biodiversity and ecosystems, infrastructure and settlements, water and sanitation, and food and agriculture.[6][7]
| Area | What the evidence shows | Financing implication |
|---|---|---|
| Low-income countries | Adaptation costs are estimated at about 3.5% of GDP.[8] | Analysis and recommendation: grants and highly concessional finance may be especially important where projects cannot support affordable commercial repayment. |
| Least developed countries and small island developing states | Combined adaptation needs are estimated at about US$50 billion per year, while public adaptation finance allocated in 2022–23 was US$10.4 billion for LDCs and US$1.2 billion for SIDS.[9][10] | Finance needs to address both affordability and access barriers, not only project preparation. |
| Private-sector potential | Private finance could contribute around US$50 billion per year by 2035, covering only about 15–20% of overall adaptation needs.[11] | Private capital can supplement, but cannot replace, public and concessional finance. |
2. Instruments that can make resilience investable
Adaptation often produces avoided losses, safer services, or more stable livelihoods rather than predictable project revenue. That makes it harder to value and finance than investments with direct cash flows. The available evidence also points to a lack of universally shared taxonomies and success metrics for adaptation.[12] The most effective financing strategy is therefore usually a package of instruments, rather than a single product.
Resilience bonds and risk transfer
A resilience bond is generally a use-of-proceeds bond: investors lend to an issuer, and the bond framework directs proceeds toward projects that reduce physical climate risks while requiring climate-risk assessment and monitoring.[13][14] This differs from a catastrophe bond, which primarily transfers disaster risk and pays the issuer when a predefined event, such as a hurricane reaching a specified loss threshold, occurs.[15]
The instruments have been applied in different contexts. The EBRD issued a US$700 million, five-year bond in 2019, with proceeds supporting resilient infrastructure, agriculture, ecological systems, and business operations.[16] In Mexico, FIRA issued a US$155 million green bond linked to climate resilience in 2023, intended to strengthen farming communities against climate risks.[17]
A broader adaptation-finance toolkit
- Blended finance: combines public or philanthropic catalytic capital with commercial debt, equity, guarantees, or other incentives so projects become more investable.[18]
- Guarantees: shift part of default or performance risk to a guarantor, encouraging lenders and investors to participate.[19]
- Insurance and parametric cover: provide compensation after specified disasters, with parametric products triggering payments when measurable conditions such as cyclone intensity are reached.[20]
- Debt swaps: replace existing sovereign debt with obligations linked to climate action, conservation, or another agreed objective.[21]
- Impact bonds and payments for ecosystem services: link repayment or compensation to verified environmental outcomes or land-management practices that provide resilience benefits.[22][23]
- Climate-resilience clauses in sovereign debt: allow debt payments or other terms to adjust after severe events; such clauses have appeared in Barbados and Grenada debt restructurings and in a later Barbados issuance.[24][25]
These tools are frequently pooled or used programmatically rather than for one project alone. One review found pooled characteristics in 75% of the cases it examined, allowing capital and risk to be shared across multiple projects.[26]
3. Why multilateral development banks matter
Multilateral development banks, or MDBs, are not only lenders. They finance resilience directly, integrate climate-risk considerations into broader development portfolios, help governments plan and prioritize investments, support policy reform, and improve access for highly vulnerable countries.[27][28][29][30][31]
Their financing spans concessional finance, investment loans, policy-based loans, working capital, credit lines, technical assistance, and risk-sharing instruments.[32][33][34][35][36][37] MDBs can also combine their own resources with donor funds, other public entities, recipient-country resources, and private investment. Their reporting distinguishes direct private mobilization from indirect mobilization through broader financing structures.[38][39][40]
Analysis and recommendation: MDBs should be assessed not only by the volume of finance approved, but also by whether projects reach financial close, remove barriers to implementation, attract additional capital, and produce credible community-level resilience outcomes. This follows from their distinctive role as project developers, policy advisers, risk-sharing partners, and investment conveners, rather than from a single published performance standard.[41][42]
4. Community projects and what should be measured
Community-based adaptation makes the finance question concrete. The CBA SCALE+ programme in Mozambique, Zambia, and Zimbabwe aims to reach more than 45,000 people across nearly 100 communities and wards. Its reported activities include participatory climate-vulnerability assessments and the beginning of Community Adaptation Action Plans.[43][44] These are useful reach and process indicators, but they are not the same as demonstrated reductions in losses or increases in income and crop yields.
The UNDP Community-Based Adaptation portfolio covers 10 developing countries and includes projects addressing water security, drought, flooding, salinity, soil conservation, agroforestry, livestock, fisheries, and resilient crops. Examples include water-source protection in Bolivia, declining water supply in Kazakhstan, flooding and sea-level rise in Samoa, and drought and saltwater intrusion in Viet Nam.[45][46][47][48][49]
One of the clearest measurement approaches in the supplied evidence is UNDP’s Vulnerability Reduction Assessment, or VRA. Communities score vulnerability to current and future climate risks, barriers to adaptation, and confidence that project activities will continue on a 1-to-10 scale. Progress is assessed through changes in these scores alongside community discussions.[50][51] Broader monitoring also covers ecosystem conditions, sustainable land management, policy effects, capacity, awareness, and natural-resource management.[52][53]
The evidence base remains limited for harder outcome measures. The supplied official extracts do not identify specific completed World Bank, Adaptation Fund, or Green Climate Fund projects with quantified results such as households gaining water access, hectares restored, crop-yield changes, income gains, people protected, or avoided losses.[54][55][56] This is an evidence gap, not proof that no such results exist. Future finance should require reporting that connects funds to locally meaningful outcomes, such as households with reliable water, days of service disruption avoided, yield stability during drought, income variability, or community vulnerability scores.
Conclusion: finance must connect capital to resilience
Climate adaptation finance can unlock resilience when it combines affordable public and concessional capital with instruments that reduce risk, including guarantees, insurance, pooled structures, debt adjustments, and resilience bonds. MDBs are central because they can prepare projects, align investment with national priorities, coordinate public and private capital, and strengthen institutional capacity.[57][58]
The practical test is whether financing reaches vulnerable communities and produces measurable improvements, not merely whether a bond is issued or a loan is approved. A stronger system would pair flexible local delivery with consistent metrics, disclose both financial mobilization and community outcomes, and recognize that private finance can contribute meaningfully while remaining insufficient to close the adaptation gap on its own.[59][60][61]
Examinons les alternatives :
- Modifier la requête.
- Démarrer une nouvelle conversation.
- Supprimer des sources (si elles ont été ajoutées manuellement).
Did Fish Really Fall at Mountain Ash?
The Mountain Ash Fish Fall, 1859
The report: On 11 February 1859, at about 9 a.m., a heavy shower of rain and small fish reportedly fell in and around Mr Nixon’s premises at Mountain Ash, Glamorganshire. A strong gale was blowing from the south, and a newspaper account said fish covered the roofs of several houses[1][2]. Some fish were still alive afterward and reportedly survived in fresh water with “apparent health”[3][4].
The proposed mechanism: Carribber suggested that the small fish might have been drawn upward in the column of a waterspout, carried by wind, and then dropped when the column dispersed into vapour and rain[5]. This was a nineteenth-century attempt to explain the event through atmospheric disturbance, rather than a demonstrated reconstruction.
What remained unresolved: The account did not establish where the fish had been lifted from. Carribber considered fresh water possible because fish placed in artificial salt water quickly died, but he explicitly admitted that this was “by no means conclusive”[6]. The case therefore shows how vivid details, multiple affected surfaces, living specimens, rain, and a gale can make a fish fall sound persuasive while still leaving its cause and exact source unproved.
Examinons les alternatives :
- Modifier la requête.
- Démarrer une nouvelle conversation.
- Supprimer des sources (si elles ont été ajoutées manuellement).
Adaptation Beyond Earth
Examinons les alternatives :
- Modifier la requête.
- Démarrer une nouvelle conversation.
- Supprimer des sources (si elles ont été ajoutées manuellement).
Redesigning Higher Education for Jobs That Do Not Yet Exist
Redesigning Higher Education for Jobs That Do Not Yet Exist
Universities cannot reliably predict the exact occupations that will emerge, but they can build programmes that adapt faster: stackable learning modules, demonstrated competencies, sustained employer collaboration, and a human-reviewed cycle that uses labour-market data and AI as signals rather than as decision-makers. The evidence supports this design direction, while also showing that existing pilots have stronger evidence of flexibility and adoption than of superior employment or earnings outcomes.[1][2][3]
The practical aim is not to replace broad education with short-lived job training. It is to help students repeatedly update their capabilities while preserving communication, critical thinking, ethical judgement, creativity, collaboration and adaptability, which remain useful when specific technologies and job titles change.[4][5][6]
A proposed degree architecture
The following architecture is a proposal informed by recurring mechanisms in the evidence, not a model already proven superior. A degree would combine a stable intellectual foundation with smaller, revisable units that can be updated without rebuilding the entire programme.
| Layer | Purpose | Student evidence |
|---|---|---|
| Foundations | Build disciplinary knowledge, quantitative reasoning, communication, ethics and critical thinking. These capabilities reduce the risk of chasing every temporary labour-market trend.[7][8] | Examinations, essays, discussions and foundational projects. |
| Competency modules | Short, stackable units focused on defined knowledge, skills and abilities. In competency-based education, progress depends on demonstrating mastery rather than simply completing a fixed amount of classroom time.[9][10] | Performance tasks, rubrics, technical outputs and portfolios. |
| Applied pathway | Connect modules to a regional or sector problem identified with employers, faculty and labour-market evidence.[11][12] | Paid placement, co-op, apprenticeship, applied research or employer-sponsored project. |
| Integration capstone | Require students to combine technical and durable capabilities in an ambiguous, real-world problem. | Public demonstration, portfolio, reflection and employer or community review. |
| Re-entry layer | Allow graduates and working adults to return for new modules or certificates that stack toward further study where transfer rules permit. | New competency record linked to the original award, with transparent credit and recognition rules. |
This design should distinguish a module from a complete qualification. The sources describe modular provision broadly as shorter, stackable certificates, courses or credentials, while competency-based education concerns how progress and mastery are assessed. They do not provide one settled definition of a modular degree, so institutions should publish exactly how modules combine, how prior learning is assessed, and what remains mandatory for the full award.[13][14][15]
- Write each competency as an observable capability, such as analysing a dataset for a defined decision, explaining uncertainty to a non-specialist audience, or designing and testing a system under stated constraints.
- Assess capability through portfolios, authentic projects, demonstrations and performance tasks, not grades alone. Portfolio-based assessment is already used in examples such as Leiden University’s crisis and security management programme.[16]
- Keep faculty responsible for academic breadth, assessment validity and progression standards. Employers should clarify workplace requirements, but should not determine the whole curriculum.
- Build student support into the model. Self-paced learning still requires organisation, technology access, feedback and meaningful interaction with faculty and peers.[17][18]
Employer partnerships as permanent curriculum infrastructure
Effective partnerships are continuous operating arrangements, not occasional guest lectures. The evidence points to a sequence in which universities and employers identify needs together, translate them into competencies, provide authentic work experience, and review graduate outcomes through shared measures.[19][20]
- Create a standing sector council with faculty, employers, alumni, students, careers staff and regional workforce representatives. Use employer surveys, workplace observation, roundtables and labour-market data to identify possible gaps.[21][22][23]
- Use employer expertise to co-design competency statements, projects, rubrics and workplace assessments. Northeastern’s Roux Institute and L.L.Bean are cited as an example of a skills-based curriculum and competency framework used to clarify employer needs.[24]
- Make work-based learning substantial and assessable. Recommended formats include paid internships, co-ops, apprenticeships, applied research and employer projects with explicit learning outcomes and mentoring.[25]
- Create visible routes from learning to work. Capital CoLAB linked digital, cyber and data-analytics credentials to priority access to internships and job interviews, while BlueSky Tennessee Institute combined an accelerated computing degree with a job offer from the sponsoring employer.[26][27][28]
- Assign a partnership lead, use standard agreements, define reciprocal contributions and publish shared metrics. Partnership measurement itself is reported as a barrier by 46% of higher-education leaders in one cited BHEF source.[29][30]
The partnership should also protect educational independence. Employers can provide current problems, tools and hiring signals, while universities retain responsibility for transferable knowledge, ethical reasoning, inclusion, assessment quality and the public purpose of the degree.
A human-led AI and labour-market forecasting loop
AI-driven forecasting should function as an early-warning and question-generation system. Tools such as Lightcast and LinkedIn Talent Insights can surface job-posting and skills patterns, but postings may omit proficiency levels, workplace context, ethical expectations and skills that employers have not yet begun to name consistently.[31][32][33][34]
Curriculum renewal loop
- Collect: combine job postings and regional hiring trends with employer surveys, advisory groups, workplace observation, graduate outcomes and faculty expertise.[35][36]
- Interpret: ask whether a signal represents a durable capability, a local shortage, a temporary technology trend or an employer-specific preference. AI should summarise patterns, not make the academic decision.[37][38]
- Design: convert validated needs into competency statements, learning activities, authentic assessments, rubrics and feedback mechanisms.[39][40]
- Test: place the new competency in a limited module or employer-linked project before adding it to the full degree.
- Review: monitor learning, completion, placement, employer feedback, student experience, equity differences, complaints, overrides, security incidents and model drift.[41][42]
Governance must include clear human accountability, cross-functional review, risk classification, privacy and vendor controls, transparency, correction rights and a route to a human decision-maker. The supplied evidence does not specify a complete forecasting model, preferred dataset, accuracy threshold or rule for adding and retiring courses, so those parameters should be tested and documented rather than presented as settled practice.[43][44][45][46]
University pilots and what they actually show
Existing programmes provide useful design precedents, but they should not be treated as causal proof that modular or competency-based education is better than conventional degrees. Their reported outcomes are uneven, and several sources call for stronger comparative evidence.[47][48]
| Pilot or model | Relevant design | Reported evidence and limitation |
|---|---|---|
| Western Governors University | Large-scale online competency-based bachelor’s and master’s provision across education, IT, health, nursing, business and data analytics.[49] | A source reports completion and satisfaction advantages, but without figures, a comparison group or methodology.[50] |
| Southern New Hampshire University, College for America | Self-paced, employer-linked, job-specific competency programmes; the institution also used modular and competency-based redesign in business administration.[51][52] | Its employer-linked design illustrates visible workplace competencies, but the supplied evidence does not establish comparative employment or earnings effects. |
| University of Michigan | Competency-based Master of Health Professions for working professionals, including assessment of existing competencies and a portfolio-based final assessment.[53] | Shows how prior learning and portfolios can support experienced professionals; the supplied material does not report causal outcome comparisons. |
| Purdue Polytechnic Institute | Transdisciplinary bachelor’s organised around themes and problem-solving, with credit for learned and demonstrated competencies; the initial cohort was 36 students.[54] | Illustrates an integrated, problem-centred architecture, but the small initial cohort limits generalisation. |
| Capital CoLAB | Multiple universities and employers developing digital technology, cyber technology and data-analytics credentials with priority internship and interview pathways.[55][56] | Demonstrates regional employer alignment, but the credentials were not established in the source as full degrees and initially had mainly regional employer recognition.[57][58] |
| Georgia Tech, Udacity and AT&T | Online computer-science master’s partnership designed for scalable access. | The programme attracted more than 25,000 applications and enrolled nearly 9,000 students during its first five years, but these figures show reach, not that the model caused better employment outcomes.[59] |
Other useful precedents include Northeastern’s paid co-op model, for which one source reports that 97% of graduates were employed full time or enrolled in graduate school within nine months, and Accenture’s earn-and-learn apprenticeship programme, which combined paid technology work with degree or credential study. These are promising models of work integration, but the reported figures do not by themselves isolate the effect of the programme from student selection, local labour markets or other factors.[60][61]
Implementation roadmap and safeguards
A university could implement the redesign incrementally rather than converting every degree at once.
- First 6 months: choose one field with measurable applied outcomes; map its existing curriculum to competencies; establish an employer-faculty-student council; publish governance, privacy and assessment principles.
- Months 6-18: launch two or three stackable modules, one authentic employer project and one paid work-based pathway. Use AI only to analyse approved data and surface hypotheses for human review.
- Months 18-30: compare pilot and existing sections on competency performance, persistence, student experience, placement quality, employer feedback and equity indicators. Record costs and transfer issues, not only enrolment.
- After 30 months: revise, expand or stop modules based on predefined review criteria. Keep a stable foundation while refreshing employer-linked modules and maintaining a public change log.
Safeguards should include valid assessments, meaningful faculty and mentor contact, credible prior-learning recognition, transparent transfer rules, accessibility support, student data protection and regular accreditation review. These controls matter because the main risks are not only inaccurate forecasts, but also narrow curricula, weak assessment, unequal access, privacy harms and employer recognition that varies by field and region.[62][63][64][65]
Conclusion
The strongest redesign is an adaptive degree, not a prediction machine: stable foundations plus revisable competency modules, authentic work experience, employer co-design and a transparent review cycle. AI and labour-market analytics can help universities notice change earlier, but faculty, students, employers and institutional leaders must decide whether a signal is meaningful, educationally sound and equitable. Existing pilots make the architecture credible, yet the next generation of programmes should measure comparative learning, employment, earnings, transfer and equity outcomes rather than relying on adoption or satisfaction alone.
Examinons les alternatives :
- Modifier la requête.
- Démarrer une nouvelle conversation.
- Supprimer des sources (si elles ont été ajoutées manuellement).
Mars Direct: Why Make the Return Fuel on Mars?
Mars Direct: Why Make the Return Fuel on Mars?
Mars Direct, proposed by Robert Zubrin and David Baker in 1990, changed the mission architecture by moving the key refueling task from Earth orbit to the Martian surface. Its central idea was simple: send the equipment and supplies first, make the return propellant on Mars, and launch the crew only after the automated system had succeeded. This reduced the amount of propellant that had to be launched from Earth, but it also made the crew's safety depend on an uncrewed factory operating reliably on another planet.[1][2][3]
The Cargo-First Sequence
The proposed sequence was cargo first, crew later. An uncrewed cargo lander would travel directly to Mars carrying the Earth-Return Vehicle, an in-situ resource utilisation plant, liquid hydrogen feedstock, and a nuclear reactor. The crewed spacecraft would not depart until the plant had produced the propellant required for the return journey, so the crew would arrive at a site where the means of getting home had already been prepared.[4]
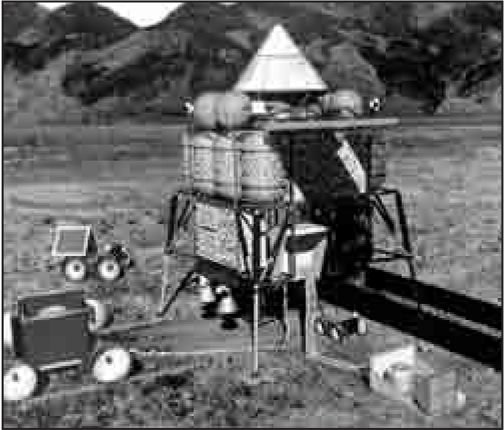
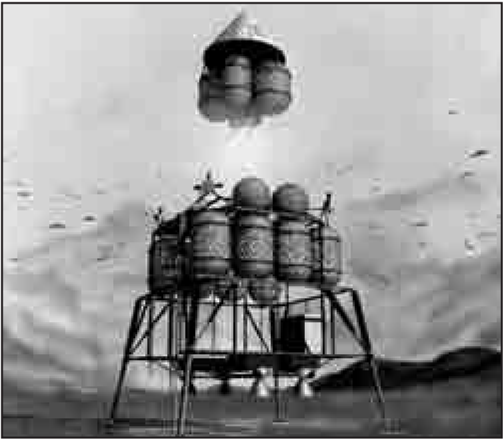
What ISRU Did in Mars Direct
In-situ resource utilisation, or ISRU, means making useful resources from materials found at the destination rather than transporting every required supply from Earth. In Mars Direct, ISRU was not a general slogan. Its specific job was to manufacture return-vehicle propellant from imported hydrogen and Martian atmospheric carbon dioxide, thereby reducing the mass that had to leave Earth.[10][11]
The chemical system worked as follows:
- The cargo lander carried 5.8 tons of liquid hydrogen as feedstock.[12]
- A 100-kilowatt nuclear reactor, transported on a robotic truck, supplied power to compressors and the propellant factory.[13][14]
- The compressors collected Martian air and supplied its carbon dioxide to the reactor system.[15]
- Through the Sabatier process, hydrogen and carbon dioxide reacted in the presence of a catalyst to produce methane and water.[16]
- The methane was stored as fuel. The water was electrolyzed to produce oxygen and recover hydrogen, allowing the hydrogen to be recycled through the process.[17]
- Additional oxygen could be made by decomposing carbon dioxide into carbon monoxide and oxygen, with the carbon monoxide vented.[18]
The source states that the factory was expected to produce 107 tons of methane and oxygen in one year. That propellant would support the return vehicle, allowing the crewed spacecraft to depart for Mars with less return fuel launched from Earth.[19]
The Architectural Trade-Off
Earlier mission concepts could require substantial propellant to be lifted into Earth orbit, assembled, and then used for the Mars expedition. Mars Direct attacked that burden by sending the cargo directly to Mars and manufacturing the return propellant there.[20][21] The benefit was lower launch mass and less dependence on extensive Earth-orbit refueling. The cost was a serious new dependency: before any astronauts left Earth, an automated plant had to land, deploy its power system, process Martian carbon dioxide, and produce a verified supply of methane and oxygen.[22][23][24]
That trade-off is the historical significance of the proposal. Mars Direct did not eliminate the difficulty of supplying a Mars mission. It relocated the most important resupply operation from Earth orbit to Mars, exchanging orbital logistics and launch mass for confidence in autonomous surface production. This discussion concerns a proposed 1990 mission architecture recorded in the history of Mars planning, not hardware that was flown or a mission that was implemented.
Examinons les alternatives :
- Modifier la requête.
- Démarrer une nouvelle conversation.
- Supprimer des sources (si elles ont été ajoutées manuellement).
Cooke’s botanical scale




Examinons les alternatives :
- Modifier la requête.
- Démarrer une nouvelle conversation.
- Supprimer des sources (si elles ont été ajoutées manuellement).
Why the Mantis Became a “Diviner
Why the Mantis Became a “Diviner”
Cowan’s writers called the mantis a diviner or fortune-teller because its name, posture, appearance, and movements invited religious interpretation. Mantis is Greek for “diviner,” while its raised forelegs resemble praying hands, producing names such as “Praying-insects,” “Soothsayers,” “Diviners,” and the French Devin and Prega-diou (“Pray to God”).[1]
Its slender body, long limbs, and slow, restrained movements were read as signs of unusual gravity rather than ordinary insect behaviour. One older claim even held that, because it raised its forelegs like a diviner, the insect could point a child toward the right road.[2] Other period accounts associated mantises with spring, death, famine, Greek soothsaying, and reverence for their movements and flight.[3]
Why Harming It Could Be Taboo
In Cowan’s account, the taboo followed from the mantis’s supposed sacred or prophetic status. When a German tried to kill one, Hottentots reportedly pleaded with him, warning of curses and divine punishment. After he released it, they celebrated and gave it customary divine honours.[4]
The accounts do not agree on whether this was worship, fear, respect, or a good-luck custom. The creature at issue is the mantis; the claims concern what harming it was believed to bring, not what the insect could actually do.
Four Witnesses, Four Levels of Claim
| Witness | Claim type | What the account says |
|---|---|---|
| Kolben | Strong account of worship and supernatural danger | He said Hottentots believed that killing a mantis would expose their cattle to destruction by wild beasts and bring death to every member of the community. He also reported that a settlement where mantises were seldom seen was considered of evil destiny.[5] |
| Sparrman | Cautious denial of worship; acknowledgment of superstition | He denied that the Hottentots worshipped the insect, noting that they gave him mantises to pin and preserve like other insects. He nevertheless described a small species that some considered dangerous and sinful to harm.[6] |
| Thunberg | Respect and luck, but not adoration | He found no evidence of worship. The mantis was held in esteem, people would not willingly hurt it, and someone on whom it settled was considered fortunate.[7] |
| Evan Evans | Vivid intermediate testimony of former worship | A Hottentot driver told Evans that he had worshipped the insect “a thousand times,” though only before coming to Bethelsdorp. This supports the possibility of earlier or personal worship without proving that all Hottentots shared it.[8] |
The resulting picture is contested rather than settled: Kolben and Evans report genuine or former worship, while Sparrman and Thunberg separate worship from fear, respect, sin, or good fortune.[9] These are recorded historical beliefs and travel accounts. They explain why the mantis was interpreted as a diviner, but they are not evidence that a mantis literally foretold events or caused the predicted disasters.
Period Interpretation and Modern Biology
In the period accounts, the mantis’s “prayer” was treated as a meaningful sign: its name, raised forelegs, strange appearance, and deliberate movements were read through religious and prophetic ideas. In modern terms, those interpretations should be kept distinct from the insect’s biology. The sources preserve beliefs about the mantis and disagreements among observers, not verified prophetic powers or a settled ethnographic consensus.
Examinons les alternatives :
- Modifier la requête.
- Démarrer une nouvelle conversation.
- Supprimer des sources (si elles ont été ajoutées manuellement).