Descobreix Pandipedia
Un directori creixent de respostes útils seleccionades per la comunitat de Pandi. Cerca a la col·lecció o explora els darrers descobriments.
2339 entrades disponibles

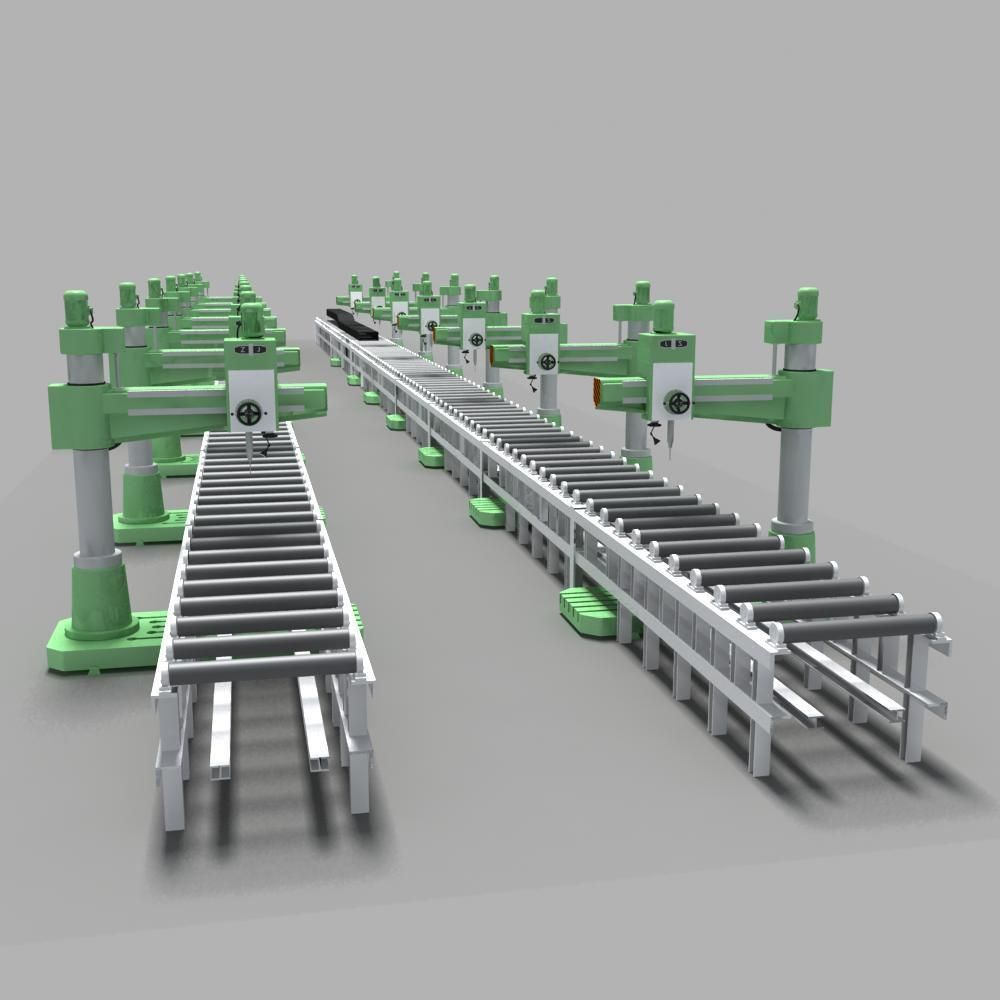
Factory Floors, Rebuilt in 3D




Veiem alternatives:
- Modifica la consulta.
- Inicia un nou fil.
- Elimina les fonts (si s'han afegit manualment).
What is the name of the open dataset released in 2024 to benchmark ethical AI behaviors?. Points to a resource for responsible AI research.
Veiem alternatives:
- Modifica la consulta.
- Inicia un nou fil.
- Elimina les fonts (si s'han afegit manualment).
new grants for rural broadband training. Fetches updates on funding that supports connectivity and digital skills in rural areas.
New grants for rural broadband training
Curated official-page leads are grouped into rural broadband connectivity and digital-skills or workforce training. The search results identify relevant 2026 opportunities, but eligibility, award amounts, supported activities, and deadlines require confirmation on the linked pages.
Rural broadband connectivity
Official USDA and NTIA sources covering rural telecommunications programs, broadband infrastructure, technical assistance, and Tribal connectivity funding. Treat current availability and deadlines as requiring confirmation.
Digital-skills and broadband workforce training
Official U.S. Department of Labor sources covering 2026 community-college and workforce-training grant materials. These are discovery leads; confirm rural eligibility, funding terms, and application deadlines in the linked notices.
Some retrieved pages were discovery results rather than fully verified funding notices. Confirm whether each opportunity is open as of August 5, 2026, and verify applicant eligibility, rural targeting, funding, and deadlines before applying.
Veiem alternatives:
- Modifica la consulta.
- Inicia un nou fil.
- Elimina les fonts (si s'han afegit manualment).
Five No-Tech Retreat Leads Worth Investigating
Veiem alternatives:
- Modifica la consulta.
- Inicia un nou fil.
- Elimina les fonts (si s'han afegit manualment).
Your Eyes Are the Next AR Controller
Transcripció
Why might eye tracking be the next big thing in augmented reality? Because your gaze can tell an interface what has your attention, without waiting for a hand gesture or controller input. Reviews link eye tracking with foveated rendering in augmented and virtual reality glasses, and with content that adapts in real time to where you are looking, potentially making experiences feel more responsive and engaging. Eye tracking systems can also compensate for head pose, helping maintain continuous gaze feedback as you move. The user experience case is just as compelling. Gaze is a natural way to explore a scene, and it can offer hands-free interaction for people who cannot use standard physical controls. In one study, however, the evidence came from virtual reality, not augmented reality, so it should not be treated as direct proof of an augmented-reality advantage. In that study, gaze followed by a nod was the fastest tested selection method, and combining gaze with a head movement helped separate deliberate commands from accidental looks. That is a promising answer to the so-called Midas Touch problem. There are still important caveats. Systems need accurate, uninterrupted feedback, users may need personalization, and designers must balance speed, comfort, and error resistance. Calibration, unintended selections, and the privacy implications of gaze data also deserve careful attention. Eye tracking is not just a new control method. It could become the layer that makes augmented reality more adaptive, accessible, and natural.
Veiem alternatives:
- Modifica la consulta.
- Inicia un nou fil.
- Elimina les fonts (si s'han afegit manualment).
Bruce Schneier on privacy, liberty, surveillance, and personal-data protection.

Privacy is an inherent human right, and a requirement for maintaining the human condition with dignity and respect.Bruce Schneier[1]




Veiem alternatives:
- Modifica la consulta.
- Inicia un nou fil.
- Elimina les fonts (si s'han afegit manualment).
Art Deco’s Materials: Evidence Check




Veiem alternatives:
- Modifica la consulta.
- Inicia un nou fil.
- Elimina les fonts (si s'han afegit manualment).
ISO standards for virtual reality safety. Link to official specs and drafts on VR hardware safety.
Curated sources
Sources are organized around the requested evidence needs.
Official ISO/IEC sources: published standards and draft
Published standards: ISO/IEC 5927:2024 addresses AR/VR safety, including safe immersion, setup, usage, and physical head-mounted displays[[cite:1]]; ISO 9241-820:2024 provides ergonomic guidance for interactions in immersive, augmented-reality, and virtual-reality environments[[cite:2]]. Draft/work-item: ISO/IEC DIS 5927 covers augmented and virtual reality safety[[cite:3]]. Additional published human-factors guidance covers VR content use and creation[[cite:4]][[cite:5]].

/IEC 5927:2024
Veiem alternatives:
- Modifica la consulta.
- Inicia un nou fil.
- Elimina les fonts (si s'han afegit manualment).
Which Classic Arcade Cabinet Are You? Choose the option that feels most like you
Veiem alternatives:
- Modifica la consulta.
- Inicia un nou fil.
- Elimina les fonts (si s'han afegit manualment).
Why does linking survey and administrative data improve income measurement without eliminating bias?. Structure the report around what surveys, tax records, and programme records each capture, followed by linkage rates, inverse-probability weighting, allocation and imputation decisions, and privacy-preserving linkage. Include a section on why the Gini coefficient can conceal where inequality is concentrated, and distinguish prototype or exploratory findings from established general conclusions.
Why linked records improve income measurement, but do not remove bias
Linking surveys with tax and programme records can produce a more complete basis for measuring income, poverty, inequality, and mobility because each source captures different populations, concepts, and kinds of error. It does not make the resulting estimates automatically unbiased: linkage failures, selective coverage, inconsistent household definitions, missing income components, and unresolved allocation or imputation choices remain consequential.[1][2][3]
The evidence supports a broad methodological lesson, not a claim that the prototype has already established one universally correct income measure. The linked-data infrastructure and several proposed procedures remain under development, while some reported results are exploratory or specific to particular datasets.[4][5]
What each source captures
| Source | Main strengths | Important gaps and biases |
|---|---|---|
| Surveys | Provide demographic and social characteristics, household and family structure, reported income and transfers, and, in the Consumer Expenditure Survey, spending and durable-good information. Its interview and diary components cover different types of purchases.[6] | Respondents may underreport income or programme receipt, and survey cases may not link to administrative records. Survey linkage is therefore selective rather than automatically representative.[7][8] |
| Tax and earnings records | Include tax returns, wage and tax statements, retirement distributions, and Social Security earnings records. They cover much taxable income and generally provide comparatively accurate reported amounts.[9][10] | They usually omit or incompletely capture non-taxable sources such as child support, veterans' benefits, welfare, SSI, gifts, bequests, and inheritances; some sole-proprietor income may also be incomplete. Administrative records can also miss commissions, bonuses, tips, business expenses, net rental income, and royalties.[11][12][13] |
| Programme records | Add participation and benefit information for programmes such as SNAP, WIC, TANF, LIHEAP, HUD housing assistance, and SSI, including payments that surveys or tax records may miss.[14][15] | Coverage may be limited to participants, selected states, or particular programmes, and the records contain limited information beyond programme administration. Thus, non-observation does not necessarily mean non-receipt.[16][17] |
Linkage rates and selection bias
The Census Bureau links records at the individual level using persistent Protected Identification Keys, or PIKs. About 99% of people in much of the administrative tax and programme data have a PIK, compared with roughly 90% to 97% of survey respondents and households; survey linkage rates are higher in more recent years.[18]
The gap matters because linked survey cases can differ systematically from unlinked cases. The proposed approach models each survey person or household's probability of receiving a PIK from observable characteristics rather than treating linked cases as automatically representative.[19]
Inverse-probability weighting
For each survey unit, the procedure estimates the probability of being PIK-linked and multiplies the original survey weight by the inverse of that probability. Under the stated representativeness conditions, this is intended to restore the linked sample's representativeness to the extent that linkage is explained by the observed characteristics used in the model.[20]
This is a correction for differential linkage, not a guarantee of unbiasedness. It cannot fully address selection driven by unobserved characteristics, inaccurate probability models, administrative coverage gaps, or measurement errors that remain after linkage. The sources present the weighting strategy as a methodological procedure whose validity depends on its assumptions, not as proof that all bias has disappeared.[21][22]
Allocation, substitution, and imputation decisions
Linking records creates additional harmonisation problems because tax units, survey households, and programme families are not necessarily the same units. The sources identify unresolved choices about direct administrative substitution versus imputation, missing-data treatment, weighting, and how to combine records defined at different levels.[23][24]
- When one administrative programme case spans multiple survey households, a proposed default allocates benefits in proportion to the number of linked individuals in each household. An alternative allocates using linked non-dependents, such as primary and secondary tax filers; sensitivity analysis may be needed because the choice can affect household income and inequality estimates.[25][26]
- For programme receipt, one proposed rule counts a person as a recipient when receipt appears in either the survey or administrative data, probably using non-imputed survey observations. This may create false positives, while receipt can still be undercounted because surveys miss benefits and administrative files do not cover every programme.[27]
- Administrative values may support substitution, improved imputation, and validation, but the sources do not prescribe one universal imputation rule. Treating administrative values as perfect would itself introduce error because some income components can be absent or incomplete.[28][29]
Consequently, a linked estimate is partly a product of analytic definitions. Decisions about whether to preserve a survey report, replace it with an administrative value, combine the two, or impute a missing value should be documented and tested through sensitivity analyses rather than hidden inside a single headline estimate.[30][31][32]
Privacy-preserving linkage
PIKs are anonymized versions of Social Security numbers assigned by the Census Bureau through probabilistic matching. They allow agencies to link records without reconciling each agency's identifiers while reducing the need to expose direct identifiers. The resulting linked files remain restricted-access data, potentially available through Federal Statistical Research Data Centers or secure data enclaves.[33][34]
Privacy protection changes the access and identification architecture, but it does not solve statistical bias. A record can be securely linked and still have incomplete coverage, a mismatched unit, an omitted income component, or a linkage error. Privacy-preserving linkage and bias assessment therefore address different risks and are complementary requirements.[35][36]
Why the Gini coefficient can conceal where inequality is concentrated
The Gini is widely used because it is a single, interpretable, and commonly published measure. Its limitation is that different income distributions can have the same Gini because the coefficient compresses the detailed shape of the distribution into one summary value.[37][38]
The attached inequality study gives a concrete illustration: Putnam County, Ohio, and Chambers County, Texas, each had a Gini of about 0.46, yet inequality was more concentrated among high-income earners in Putnam County and among lower-income earners in Chambers County. The top 10% held 38.7% of income in Putnam County versus 32.1% in Chambers County.[39][40]
This means that a similar overall Gini does not imply similar policy problems. Analysts should supplement it with distributional information, such as top and bottom income shares, or use a model that represents more than one feature of the distribution. The source discusses the Zanardi index and a two-parameter Ortega model, whose parameters are intended to distinguish concentration toward the top from inequality more pronounced among the bottom and middle percentiles.[41][42][43][44]
These alternatives are not established universal replacements. The study reports that the Ortega model fit better than the alternatives it evaluated for 3,056 US county-level distributions, but another dataset or country could favour another model; the authors also note that there is no consensus on the best alternative measure.[45][46][47][48][49]
Established lessons versus prototype and exploratory findings
| Status | What can reasonably be concluded |
|---|---|
| Broader methodological lesson | No single source provides a complete income measure. Combining sources can provide broader coverage, but coverage, linkage, imputation, allocation, and definitional choices must be evaluated.[50][51][52] |
| Established limitation | A single Gini can conceal whether inequality is concentrated at the top, bottom, or middle of the distribution, so its interpretation should be supplemented with distributional detail.[53][54] |
| Prototype or provisional | The CID's planned uses, expanding coverage, income concepts, substitution and imputation rules, weighting, and benefit allocation are still under development rather than settled outcomes.[55][56][57][58][59] |
| Exploratory or source-specific | The reported SIPP findings and the Ortega model results are tied to particular data, models, populations, or comparisons. They should not be generalized automatically to every survey, programme, country, or period.[60][61][62][63][64][65] |
Conclusion
Linkage improves income measurement by combining survey context and spending information with tax, earnings, and programme records that cover different income components and benefits. It reduces reliance on any one source, but it cannot eliminate bias because linkage is incomplete and selective, administrative coverage is imperfect, and allocation, imputation, weighting, and income definitions remain consequential.[66][67][68][69]
The practical implication is to report linked estimates with transparent linkage rates, weighting assumptions, coverage limits, reconciliation rules, and sensitivity checks. Inequality results should likewise avoid relying on the Gini alone: the headline level should be accompanied by evidence showing where in the income distribution inequality is concentrated, while prototype and exploratory findings should be labelled as such rather than presented as general conclusions.[70][71][72]
Veiem alternatives:
- Modifica la consulta.
- Inicia un nou fil.
- Elimina les fonts (si s'han afegit manualment).